24 practical manufacturing KPIs for time-starved production managers

When you look closer, working in any manufacturing industry can resemble a relay race.
Ultimate speed in every leg of the race, battling against quick rivals, and aligning your team towards a unified goal is both challenging and rewarding. As a production manager, your job is similar to the head coach of the relay team, but with smart manufacturers instead of sprinters. Like a head coach, you need to track your team’s performance — this is where manufacturing KPIs can help.
In this article you will find a longer list of key performance indicators (KPIs) to help you find or save your most valuable resources. Here you’ll find 24 quality KPIs in manufacturing that you can consider implementing.
Manufacturing KPIs — the good, bad, and the ugly

Speed, efficiency, and the ability to assess situations from all angles are critical. Sometimes you have the time to take a deep dive into your data to spot opportunities and areas of improvement, yet there are so many responsibilities on the daily plate and so few hours to spare.
Before browsing through the KPIs listed below, let’s set the record straight about manufacturing KPIs.
Manufacturing KPIs are not magical spells that your competitors haven’t heard of. They are popular and easy-to-find tools. Many use them to monitor and optimize production processes. Each manufacturing company and its respective product manager(s) has its own set of tools.
As the company grows, the production manager can feel an imminent urge to add more KPIs for manufacturing. Primarily tracking your manufacturing cost per unit, throughput, and cycle times can feel too simplistic. But in reality, more KPIs aren’t always the right approach. You don’t necessarily have to multiply the number of trackable manufacturing KPIs when your company grows.
Another ugly truth is that manufacturing analytics often rely on data from clunky spreadsheets and charts prone to human error. Manufacturing management software that presents data that is also accurate can be helpful, especially if it integrates with different programs that suit your specific manufacturing needs.
The most important Manufacturing KPIs

As already stated, some, if not most, KPIs might not be necessary to implement.
However, for manufacturing professionals, these are considered the most important ones to use along your production lines.
1. Cycle times
Experienced managers who work for manufacturing industries define cycle times as the average time spent on producing products.
One of the great manufacturing KPI examples is the automobile industry.
A Toyota car’s cycle time is about 18 hours, while a handmade Rolls-Royce car’s cycle time is about 4,320 hours (or six months). However, the term has more layers to it. In the car manufacturing industry, cycle times are also used to measure the time it takes to produce a finished vehicle’s gearbox or driver’s seat. This KPI for production managers uses this metric to measure the time it takes for the car to reach the dealership.
In short, cycle times are a good indicator of how quick your manufacturing process is.
Cycle times = Process End Time – Process Start Time
What’s the difference between lead time and cycle time?
Lead time and cycle time are two manufacturing KPIs that are often confused with one another.
In a nutshell, cycle time measures the time it takes for a team to make a product, while lead time measures the time between the order input and order fulfillment. Cycle time fits into the timeline of lead time.
2. Throughput
Throughput is often considered the holy grail of production metrics. It measures the production capabilities of a machine or production line. Throughput gives manufacturers the necessary data to understand how much they can produce over a specified period.
Ideally, throughput should be monitored on a real-time weekly basis. This is because any considerable decrease in the number of units being produced can highlight a major problem — which you can then resolve as quickly as possible.
Throughput = # of units produced / time (day, week, month, one day)
3. Takt time
Takt time is the maximum permissible amount of time spent on manufacturing a product while meeting a client’s deadline. The KPI originates from German manufacturing, which is known for its efficiency.
Like cycle times, takt time helps you schedule production orders and helps you understand whether you can deliver on your promises before you make them.
Takt Time = Net Available Time / Customer’s Daily Demand
4. Production attainment
This manufacturing KPI measures production levels over a specific time and simultaneously calculates how often a target production level is achieved.
Production Attainment = # of Periods Production Target Met / Total Time Periods
5. Manufacturing costs per unit
Manufacturing businesses need to know the total costs associated with manufacturing a product. How else would you know how to price products? Typical manufacturing costs include labor, raw materials, overhead, and many others.
Manufacturing Costs Per Unit = Total Manufacturing Costs / # of Units Produced
6. Energy costs per unit
This is the manufacturing KPI that is increasingly relevant every year. More clients are demanding environmentally-friendly products, and energy manufacturing is becoming an expensive political weapon that can skyrocket the price of your products.
The energy costs per unit metric calculate the total energy costs and divide them by the units produced in a specified timeframe.
Energy Cost Per Unit = Total Energy Cost / # of Units Produced
7. Inventory turns
Excessive inventory might be helpful in an era of market disruptions, but if it’s becoming the norm, it’s usually a sign of poor sales and market turbulence. Inventory turns is a manufacturing KPI that will help you measure how often merchandise is sold over a specific time period.
Low ratio numbers indicate meager sales and redundant inventory. High ratio numbers stand for strong sales or insufficient stock.
Inventory Turns = Cost of Goods Sold / Avg. Inventory
Manufacturing KPIs for monitoring efficiency

We’ve covered seven universal KPIs for manufacturing. In this section, we’ll introduce three manufacturing KPIs that will help you gauge the efficiency of your operations.
8. Overall equipment effectiveness (OEE)
Overall equipment effectiveness (OEE) measures the efficiency of all operations. This manufacturing KPI is another must-have if you want to ensure your machines are productive. The higher your OEE, the more effective your equipment is.
OEE is a KPI for manufacturing performance, quality, and availability but includes scheduled time only. If the machine is not scheduled or maintenance is performed, the OEE doesn’t factor in this time.
OEE = Performance x Quality x Availability (actual production time / scheduled time)
9. Overall operations effectiveness (OOE)
Overall operations effectiveness, or OOE measures the availability of all operations from the beginning to the moment they end. Manufacturing industries track this metric to better understand how their processes are running.
For example, planned maintenance for machines is included in the OOE calculation but not in the OEE calculation. Machines are generally not productive during maintenance times — if they are, then hold onto them. Visualized OOE data gives production managers ideas on improving their processes for optimal output.
OOE = Performance x Quality x Availability (actual production time/ operating time)
10. On-time delivery (OTD)
OTD is a straightforward metric that will show you how much of your products are delivered on time. You want to keep this metric to the round, beautiful number of 100%, but it will be a challenge in an era of disrupted logistics.
If you consistently keep OTD close 100%, never hesitate to ask for a higher salary from your boss or higher rates from your customers! Be wary of abusing this manufacturing KPI since the thrill of chasing the elusive 100% can lead to an unrealistic production schedule and cutting corners on quality.
On-Time Delivery = (# Units Delivered on Time * 100) / # Units Delivered
Manufacturing metrics for tracking cost and profitability
It’s all very well and good setting up processes for monitoring your manufacturing — but if the bread isn’t being brought, all your efforts will be for naught.
Here are the KPIs for tracking your costs and profitability.
11. Cost of goods sold (COGS)
This is the total cost of the materials, labor, and overhead needed to produce a product. Tracking COGS helps you identify areas where you can reduce costs.
The formula calculates the total cost of the goods sold during the period by subtracting the ending inventory from the sum of your beginning inventory and purchases during a period. This formula is commonly used in manufacturing, retail, and other industries that produce or sell physical products. It is an important metric used in determining the profitability of a business, as well as for tax purposes.
The formula for calculating the cost of goods sold is as follows:
COGS = Beginning Inventory + Purchases During the Period – Ending Inventory
12. Gross profit margin (GPM)
This measures the profit you make on each product sold. Gross margin is calculated by subtracting the cost of goods sold from the revenue and dividing that number by revenue.
The gross profit margin is expressed as a percentage, which indicates the amount of profit generated for each dollar of revenue earned. A higher gross profit margin indicates that a company can generate more profit from its sales after accounting for the direct costs associated with production.
The formula for calculating the gross profit margin is as follows:
Gross Profit Margin = (Revenue – Cost of Goods Sold) / Revenue
13. Net profit margin
This measures the overall profitability of the company. Net profit margin is calculated by subtracting all expenses (including COGS, labor, overhead, and taxes) from revenue, then dividing that number by revenue.
The net profit margin measures a company’s profitability, which indicates the percentage of revenue that remains after all expenses have been deducted. It is expressed as a percentage and can be used to compare or track different companies’ profitability over time. A higher net profit margin indicates a more profitable company, as it means that the company can generate more profit from each dollar of revenue earned.
The formula for calculating the Net Profit Margin is as follows:
Net Profit Margin = (Net Income / Revenue) x 100
What’s the diff?
Gross profit margin measures the profitability of a company’s core business activities.
Net profit margin measures the company’s profitability as a whole, considering all expenses incurred.
Both metrics are important in evaluating a company’s financial performance and are commonly used in financial analysis and reporting.
14. Return on investment (ROI)
This measures the return on the money you invest in your manufacturing operations. ROI is calculated by dividing the profit by the investment, then multiplying by 100 to get a percentage.
The ROI is expressed as a percentage and is used to evaluate the profitability of an investment. A higher ROI indicates a more profitable investment, as the investor earns a greater return on their investment. The ROI can be used to compare the profitability of different investments or to track the profitability of a single investment over time. It is an important metric for making investment decisions and evaluating an investment portfolio’s performance.
The formula for calculating the Return on Investment (ROI) is as follows:
ROI = (Net Profit / Total Investment) x 100
KPIs for manufacturing compliance
Safety first.
A healthy and safe workforce means your business can keep on chugging. In some instances, a specific industry might have regulations they must follow to comply with governmental policies. Here are some KPIs you can introduce to track your company’s compliance.
15. Reported Health and Safety Incidents
A manufacturing business can monitor reported health and safety incidents by implementing an incident reporting system and regularly reviewing and analyzing incident reports.
The incident rate can be used to track the effectiveness of a company’s health and safety programs over time and to compare the company’s safety performance to industry benchmarks. A lower incident rate indicates a safer work environment and better health and safety performance.
The formula for calculating the incident rate is as follows:
Incident Rate = (Number of Incidents / Total Hours Worked) x 200,000*
*200,000: A constant that is used to standardize the incident rate and express it as the number of incidents per 100 employees.
16. Lost time injury frequency rate (LTIFR)
LTIFR measures the number of lost time injuries in a workplace per million hours worked. Injuries that cause a worker to miss work more than one day are called lost time injuries.
LTIFR is a commonly used metric for measuring a company’s health and safety performance. It is used to track the number of lost time injuries that occur within a workplace over time and to compare the company’s safety performance to industry benchmarks. A lower LTIFR indicates a safer work environment and better health and safety performance.
The formula for calculating the LTIFR is as follows:
LTIFR = (Number of lost time injuries x 1,000,000) / Total hours worked
17. Environmental incident rate
The environmental incident rate measures the number of reportable environmental incidents within a defined period, usually expressed as the number of incidents per million hours worked or per million dollars of revenue.
The environmental incident rate can be used to track the effectiveness of a company’s environmental management programs over time and to compare the company’s environmental performance to industry benchmarks. A lower environmental incident rate indicates better environmental performance.
The formula for calculating the environmental incident rate is as follows:
Environmental Incident Rate = (Number of Reportable Environmental Incidents / Total Hours Worked or Total Revenue) x 1,000,000
Manufacturing KPIs for customer experience and responsiveness

Another factor to consider is that customers are the driving force behind your business.
Without their patronage, you’re doomed to failure. The following manufacturing KPI examples can help you understand how your business is doing on the customer front.
18. On-Time Delivery (OTD) Rate
The OTD rate measures the percentage of orders delivered to the customer on or before the promised delivery date.
The OTD rate is a commonly used metric for measuring a company’s delivery performance. It is used to track the number of orders delivered to the customer on or before the promised delivery date over time and to compare the company’s delivery performance to industry benchmarks. A higher OTD rate indicates better delivery performance and customer satisfaction.
The formula for calculating the OTD rate is as follows:
OTD Rate = (Number of orders delivered on or before the promised delivery date / Total number of orders) x 100
19. Customer Fill Rate (CFR)
The CFR measures the percentage of customer orders that are filled in full and on time.
The CFR is a commonly used metric for measuring a company’s ability to meet customer demand. It is used to track the number of customer orders that are filled in full and on time over time and to compare the company’s performance to industry benchmarks. A higher CFR indicates better customer satisfaction and loyalty.
The formula for calculating the CFR is as follows:
CFR = (Number of customer orders filled in full and on time / Total number of customer orders) x 100
20. Customer Return Rate (CRR)
The CRR measures the percentage of products that customers return due to defects, quality issues, or other reasons.
The CRR is a commonly used metric for measuring a company’s product quality and customer satisfaction. It is used to track the number of products that are returned by customers over time and to compare the company’s performance to industry benchmarks. A lower CRR indicates better product quality and customer satisfaction.
The formula for calculating the CRR is as follows:
CRR = (Number of products returned by customers / Total number of products sold) x 100
KPIs for gathering quality metrics

KPIs for quality metrics in manufacturing are essential because they provide a means for measuring and monitoring the effectiveness of a company’s quality management system.
Quality KPIs allow manufacturers to identify areas where improvements can be made, track progress over time, and ensure that quality standards are consistently met or exceeded.
21. Defect density
Evaluating defect density is something smart manufacturers use since it allows you to compare the quality of different products and lines. The formula is also simple — divide the number of defective products by the total number of produced products.
If you use this manufacturing KPI regularly, you will avoid costly recalls, diminished profitability, and a damaged reputation.
All that it requires is examining your quality assurance and final production data.
Defect Density = Defective Products/Total Produced Products.
Manufacturing KPIs for staying lean

Lean manufacturing is a practice of Japanese origin that focuses on minimizing waste without sacrificing productivity. However, waste in this context doesn’t mean garbage or defective parts. In lean manufacturing, waste is any activity that does not add value from a customer’s perspective.
Here are three lean manufacturing KPIs to help you reduce waste of all kinds.
22. First pass yield or throughput yield
Also known as throughput yield, this manufacturing KPI tracks the quality and development of production processes.
Specifically, throughput yield calculates the percentage of products manufactured to specification the first time around. In time, a high yield rate will lead to decreased rework expenses and increased profitability.
First Pass Yield Rate = Quality Units / Total Units Produced
23. Downtime to operating time (DOT)
DOT can measure the effectiveness of machinery maintenance and the machine itself.
Suppose effective preventative maintenance is your main priority. In that case, the downtime can be reduced if you follow this metric and use it to create a more optimal manufacturing process. Lean manufacturing companies aspire to reduce this ratio as much as possible.
DOT = downtime / operating time
24. Material yield variance (MYV)
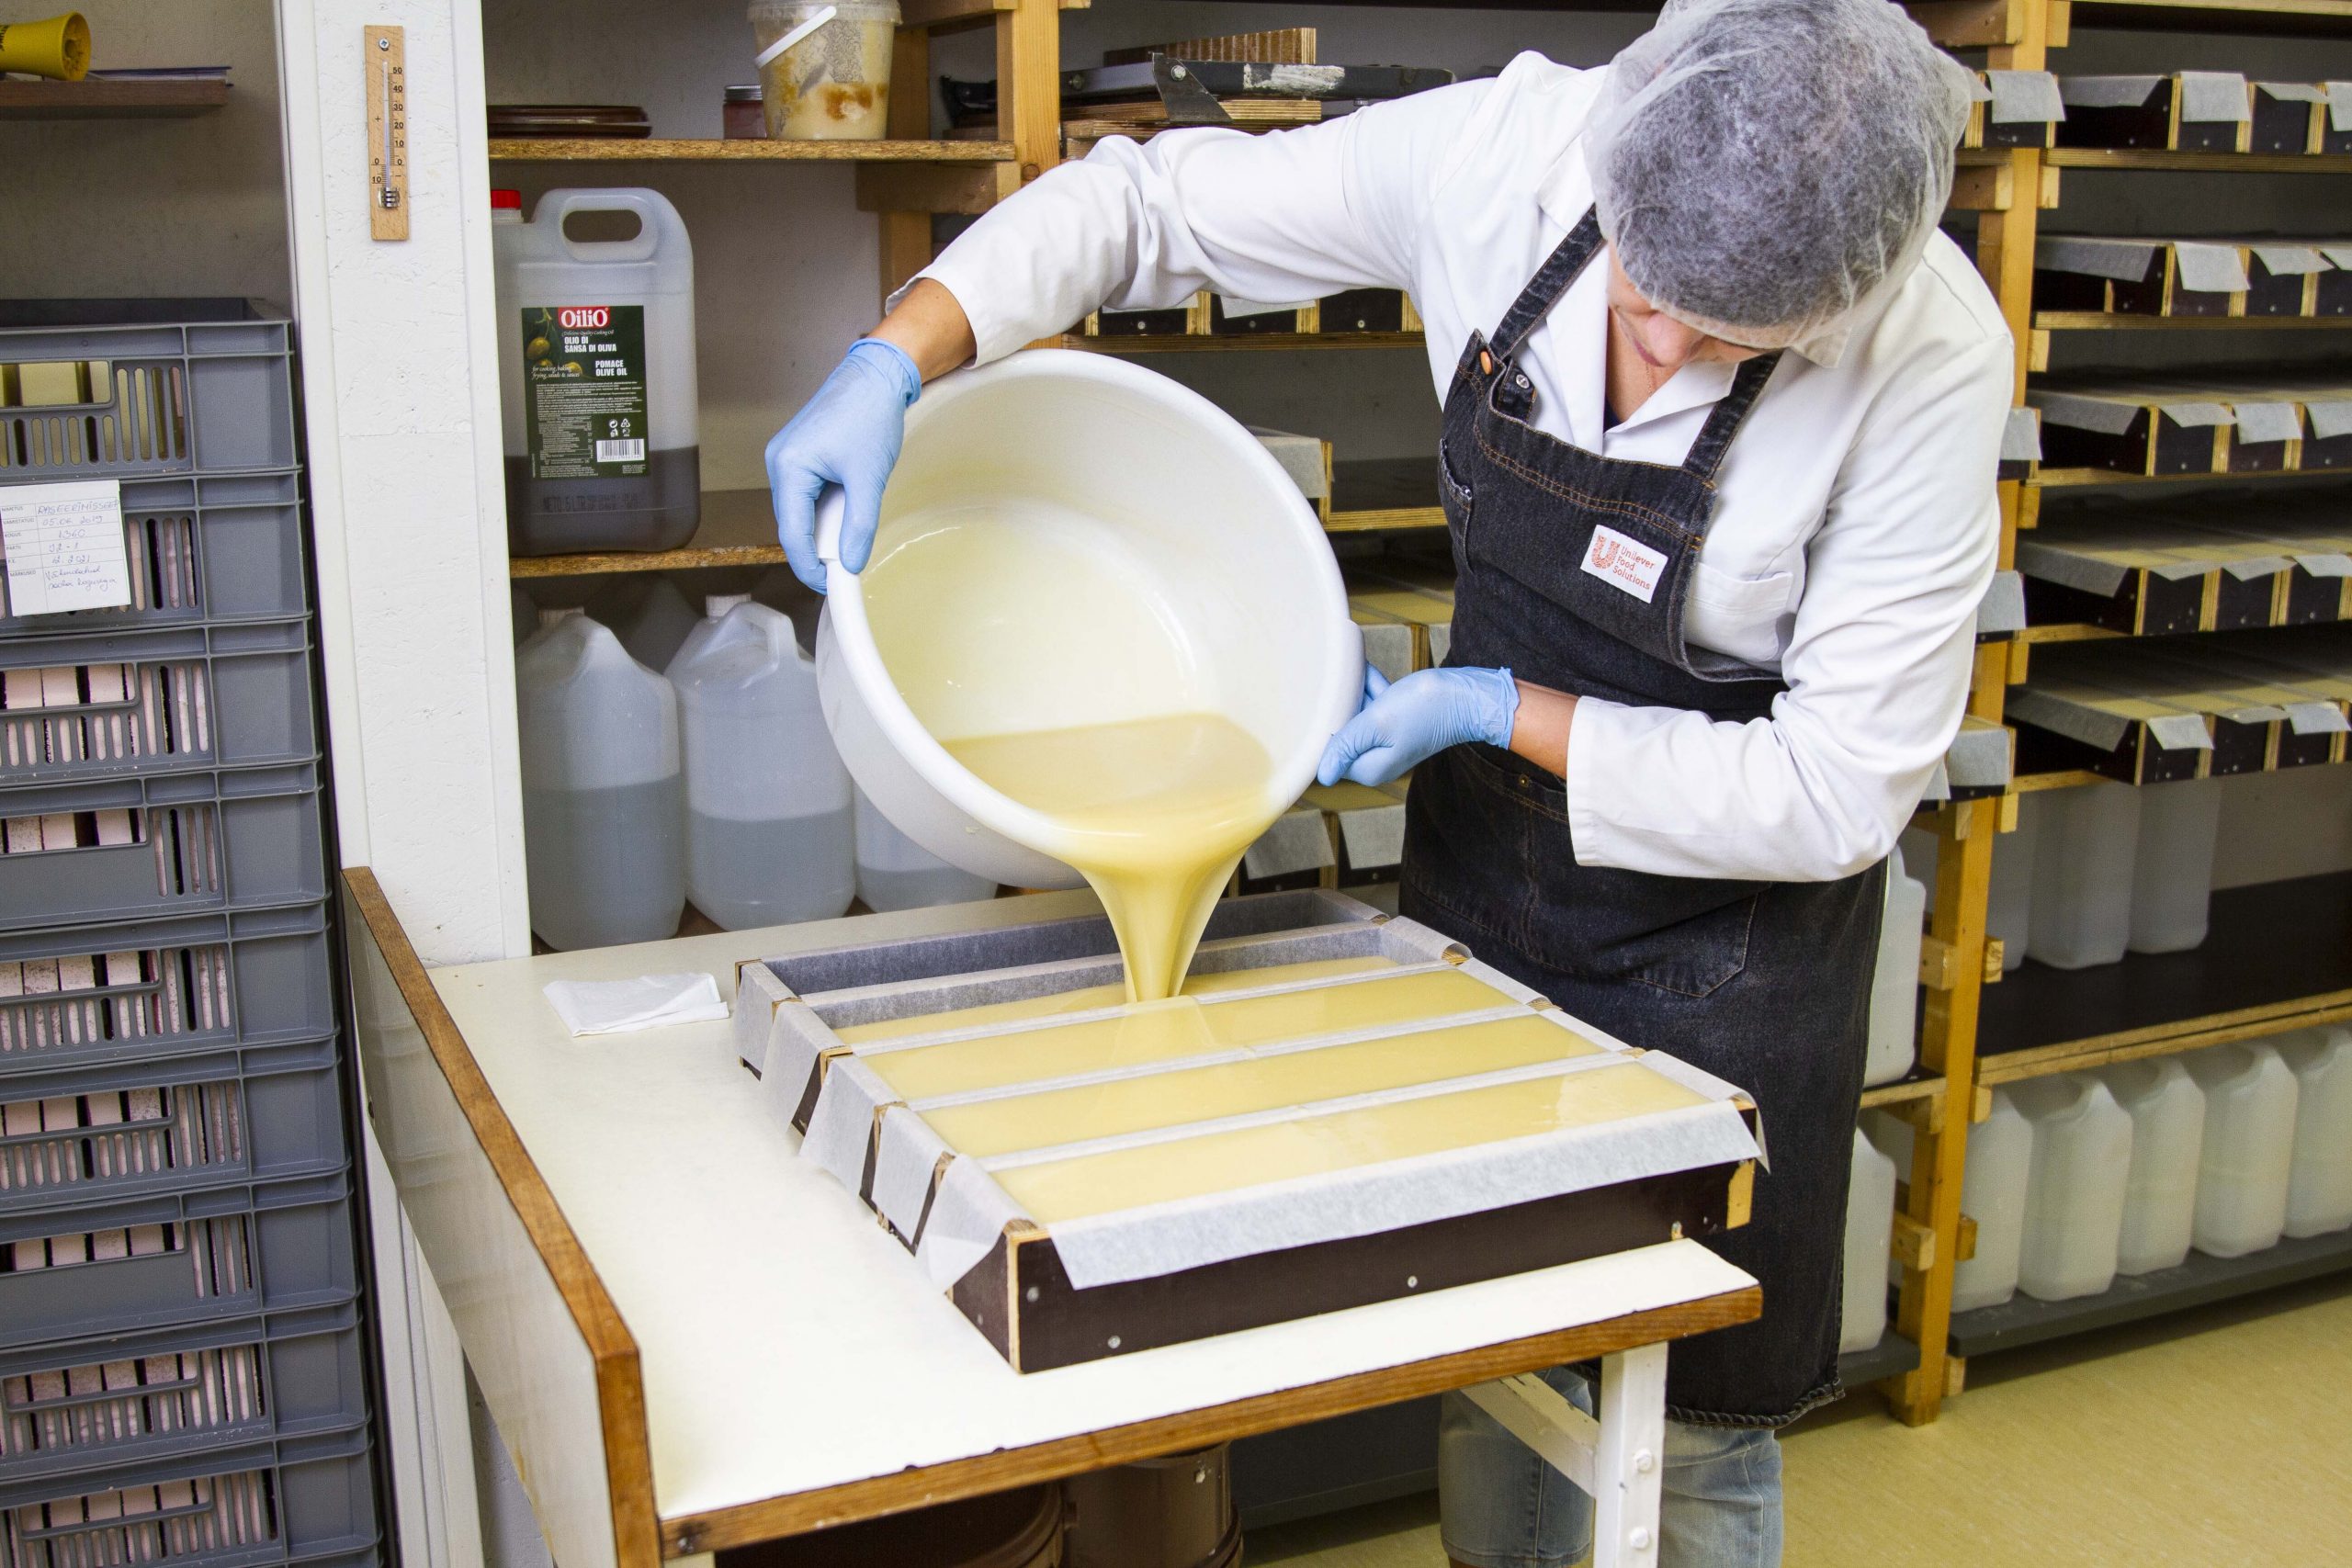
Say you work for ACE Beaute, a small cosmetics company that processes raw materials. This lean manufacturing KPI takes the estimated amount of materials required for a product and compares it against the number of raw materials used.
In short, analyzing yield variance helps production managers maintain control over material usage.
Material yield variance = actual material use / expected material use
Parting advice on manufacturing KPIs
Congratulations, you now have all the info you need on manufacturing KPIs. Hopefully, you found several or at least one manufacturing KPI that you will implement to cut production time and manufacturing costs.
Manufacturing analytics is meant to improve efficiency and propel your growth as a result. Pair your newfound knowledge and interest in manufacturing KPIs with the quest to find modern ERP software that will streamline data collection. Calculating all those KPIs in messy and overloaded spreadsheets will likely be confusing and stressful.
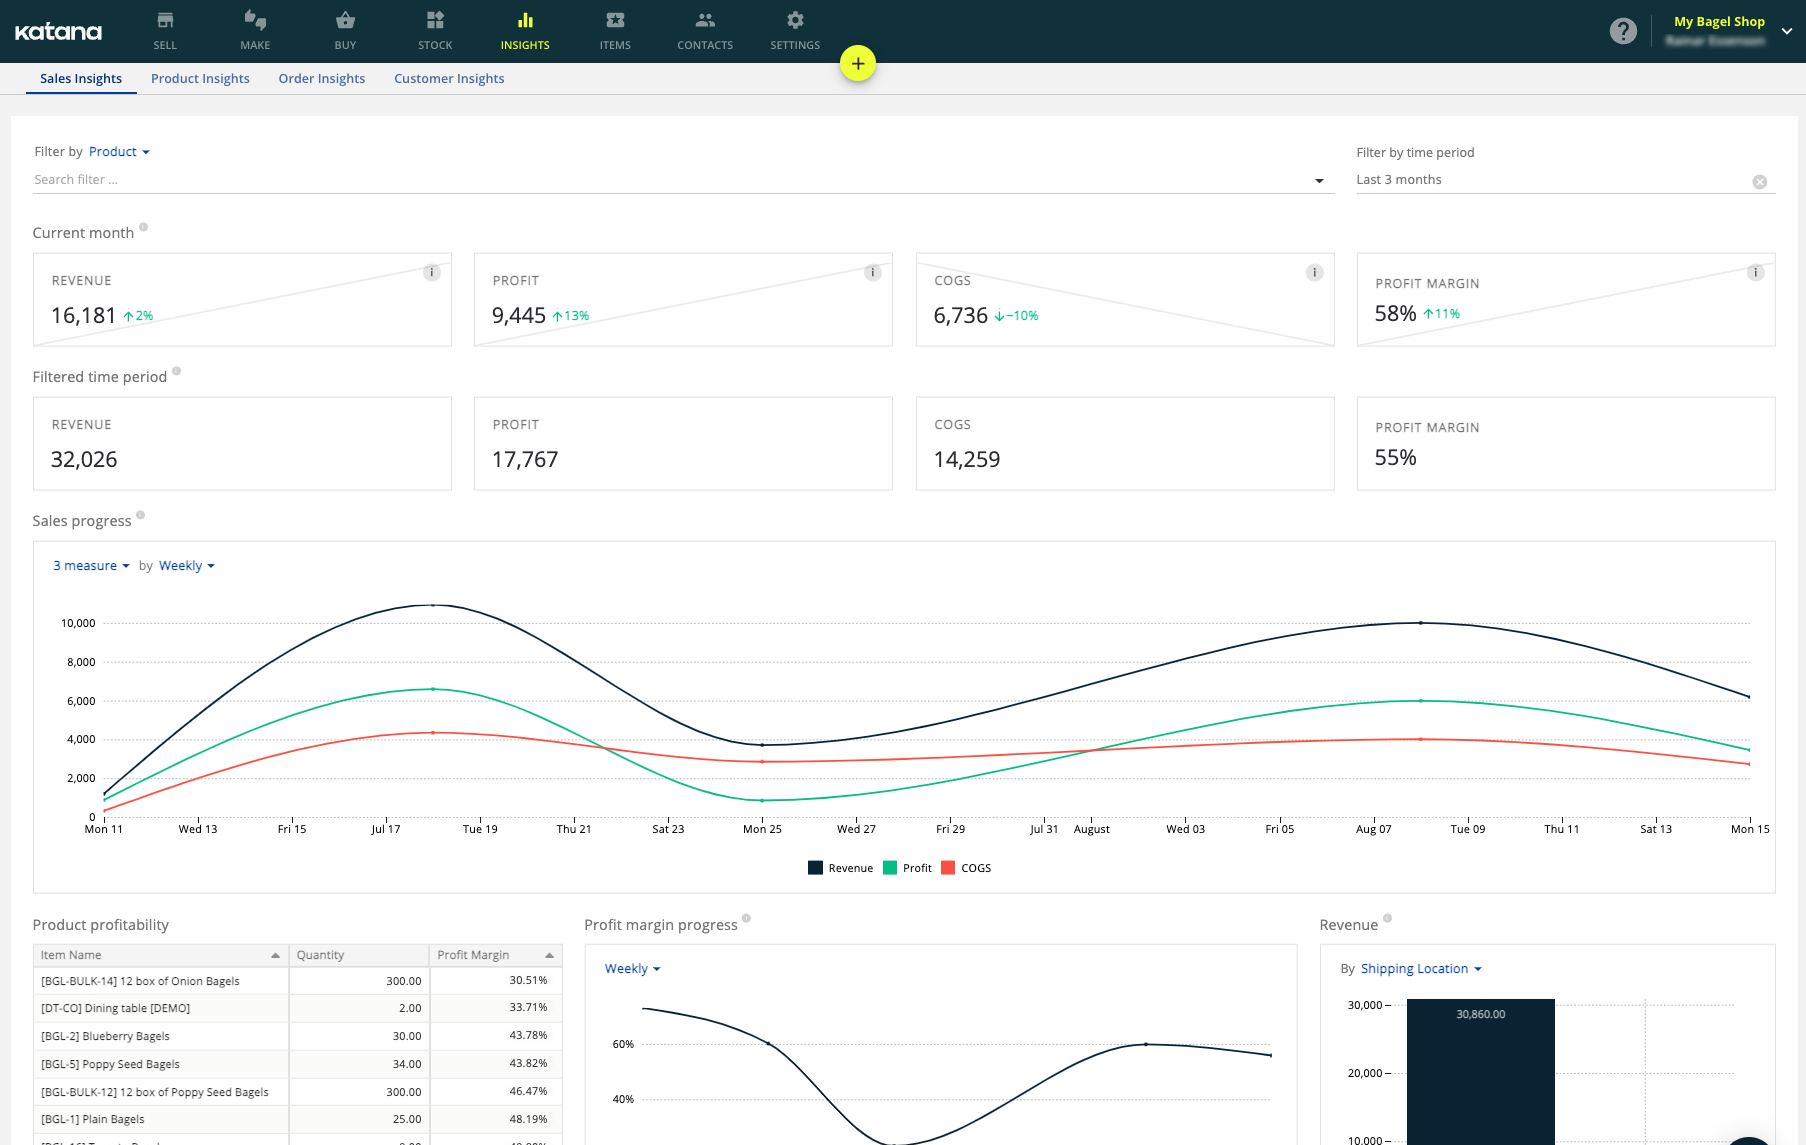
How Katana helps you track manufacturing KPIs and metrics

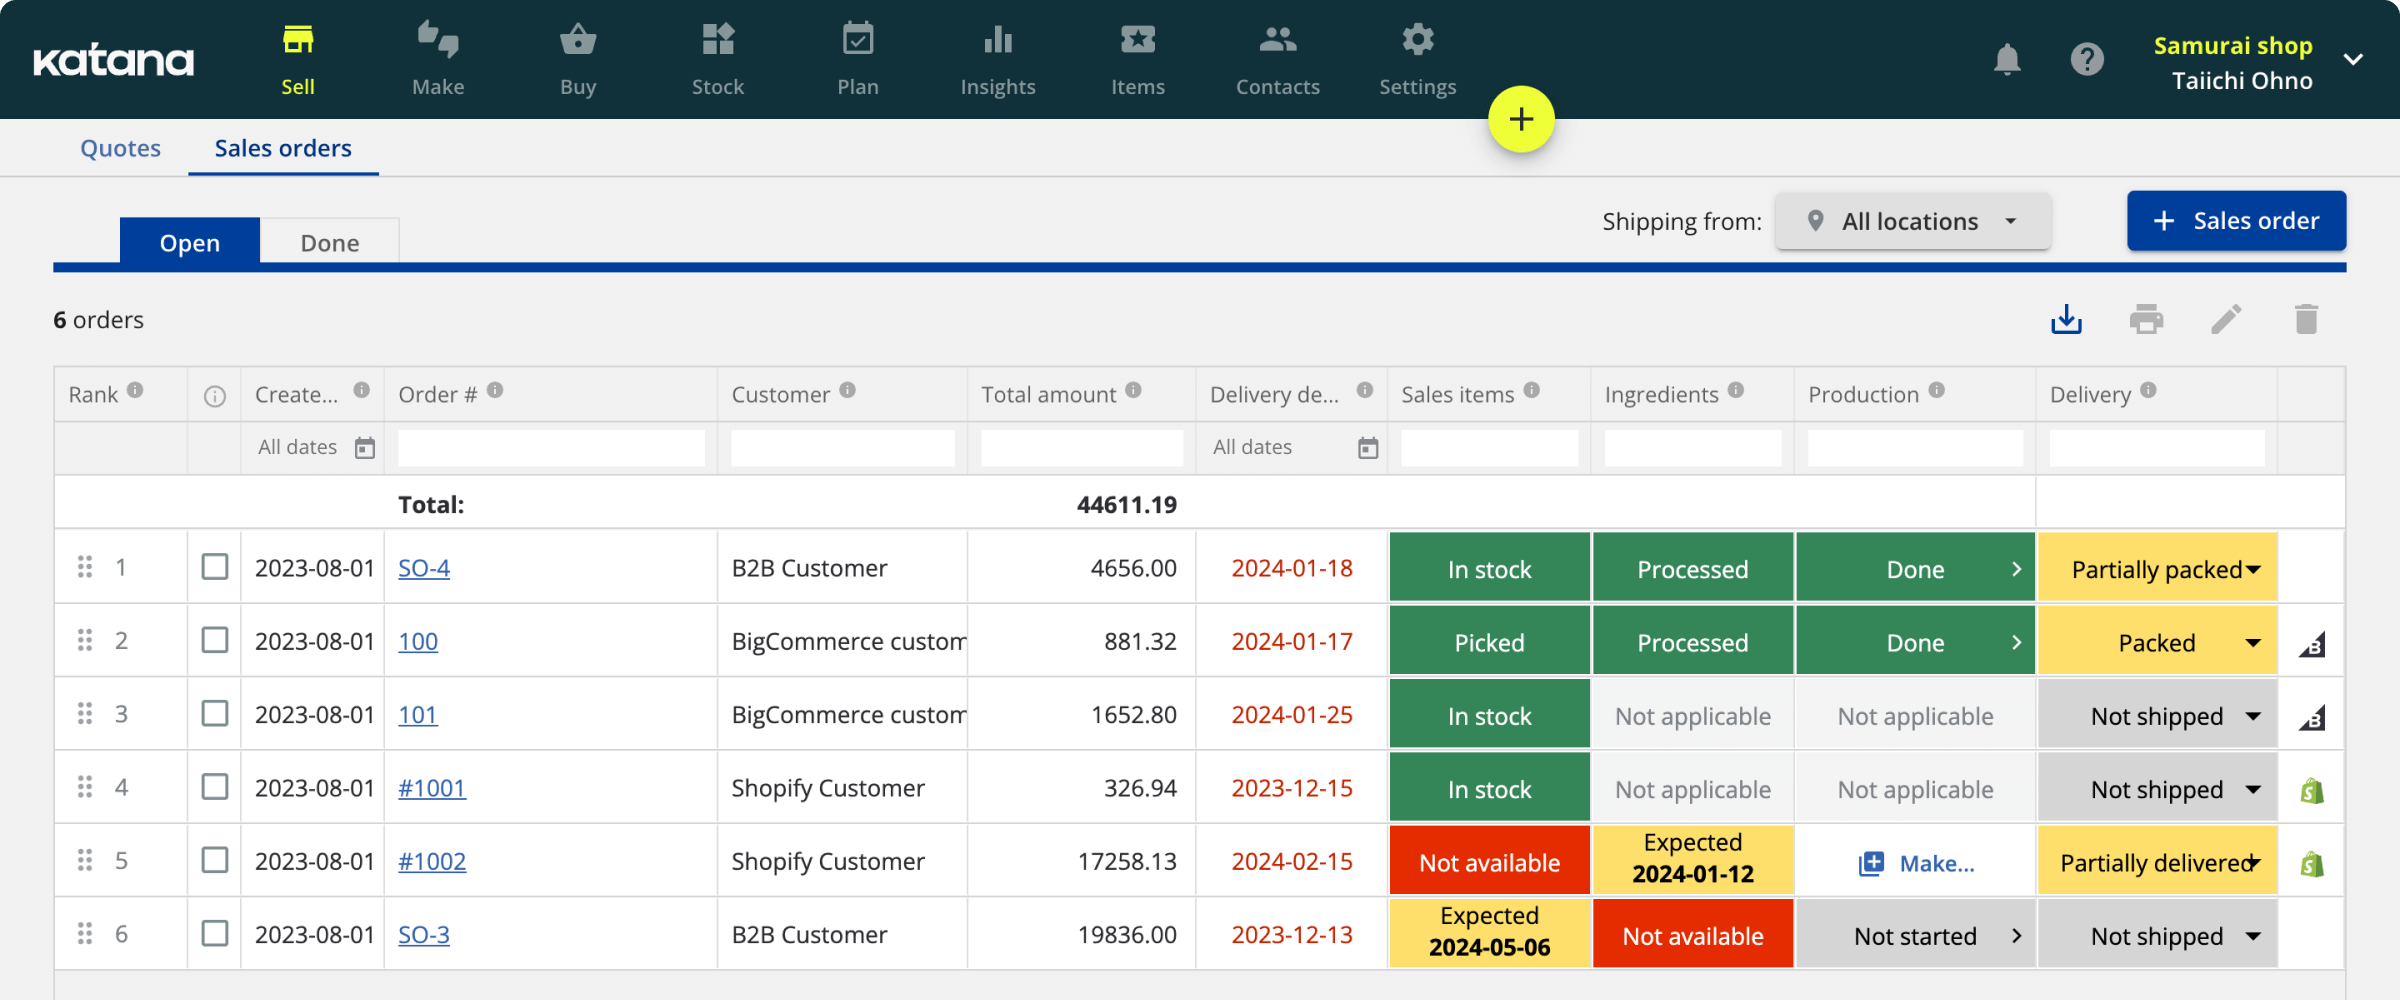
Katana is an all-in-one solution for smart manufacturers. With great inventory control, clear resource production planning KPIs, and great distribution integration, Katana is the ideal manufacturing software.
If you want to track demand, so your production schedule matches your lead times, Katana manufacturing software will be your helpful assistant.
Katana helps manufacturers increase their profits with.
A real-time master planner
Katana manufacturing software automatically takes available finished goods and raw materials. It allocates them to open sales and manufacturing orders, helping you understand your production capabilities briefly and fulfill orders even quicker.
End-to-end traceability
Our features are designed to give you full traceability – useful if you want to use cycle times as a KPI – throughout your entire product lifecycle.
Katana supports batch tracking for manufacturing, purchasing, and sales orders, ensuring industry compliance and visibility when tracking your perishable stock.
Integrating with your favorite tools
Many manufacturers rely on third-party software to rake in profits. Katana integrates with Shopify, WooCommerce, and other platforms so you can manage your manufacturing operations from one place. It’s even capable of integrating with accounting software such as QuickBooks Online too.
Katana’s integration partners are companies that connect their products with us. Our systems are connected via a safe software application. These apps enable customers to use several technologies on a single platform.
If you have any questions, our customer support team is ready and waiting to help assist you.
Start implementing your new manufacturing KPIs with our software. Book a demo with Katana, and start scaling your business today.
More guides from Katana


Get visibility over your sales and stock
Wave goodbye to uncertainty by using Katana Cloud Inventory for total inventory control