Manufacturing analytics: The metrics you need
Manufacturing analytics is the process of collecting and deriving insights on operations and technologies to improve your business’ health.


Without a plan, you will be lost and rudderless in the high seas of business management.
Sure, you can make a plan following some guides online. But with no tools or information to help create these plans, it’ll just be another aimless endeavor that leaves you going in circles. So, what can you do to make sure your business is on the right path to success?
In this article, we’ll look into manufacturing analytics — an essential tool for optimizing your business.
Manufacturing analytics supports you in making data-driven decisions that can improve your business’ overall performance. By analyzing data related to production, quality control, and other aspects of manufacturing, organizations can identify areas where they can make changes that will lead to improvements. So, without further ado, let’s begin.

What is manufacturing analytics?
Manufacturing analytics involves investigating your operations and significant events, usually with technology, to ensure quality, increase productivity, reduce manufacturing costs, and optimize supply chains.
With manufacturing process analytics, companies can identify issues and trends that would otherwise go undetected, leading to improved decision-making and increased efficiency. Manufacturing analytics can be used to track quality control issues, optimize production schedules, predict equipment failures, and so much more.
The benefits of manufacturing analytics are numerous, but perhaps most importantly, it can help companies avoid costly mistakes and increase their bottom line.

What analytics for manufacturing should you track?
In any manufacturing business, efficiency is key.
The whole purpose of manufacturing, after all, is to produce goods quickly and efficiently. To do this, manufacturers must closely monitor their production process, measuring various performance indicators (KPIs) along the way. There are countless KPIs that manufacturers can track, but some are more important than others.
Here are 8 of the most important KPIs for any manufacturer.
1. Overall Equipment Effectiveness (OEE)
OEE is a metric that measures how effectively a manufacturing machine or process is being used. It considers factors such as downtime, speed, and quality to give you a comprehensive picture of your machines or process’s effectiveness.
Here is the formula for calculating your OEE:
OEE = Availability x Performance x Quality
2. First Pass Yield (FPY)
FPY is a measure of the percentage of products that are produced correctly on the first try. A high FPY means that your manufacturing process is efficient and has few defective products.
FPY = Quality Units / Total Units Produced
3. Production Downtime
Downtime is any time when a machine or process is not in operation. Downtime can be caused by scheduled maintenance or unexpected problems. Regardless of the cause, downtime is costly for manufacturers because it reduces overall production capacity.
Time resource is down / Planned operating time x 100 = Downtime %
4. Mean Time Between Failures (MTBF)
MTBF measures how long a machine or process can operate before it experiences a failure. A high MTBF indicates that a machine is reliable and doesn’t require frequent maintenance.
MTBF = # of operational hours / # of failures
5. Cycle Time
Cycle time is the amount of time it takes to complete one manufacturing cycle. A shorter cycle time means a product can be produced more quickly, leading to increased efficiency and lower production costs.
Cycle Time = Net production time / Number of units produced
6. Lead Time
Lead time is the time it takes from when an order is placed until it is delivered to the customer. A shorter lead time means customers will receive their orders more quickly, improving customer satisfaction.
Lead time = supply delay + reorder delay
7. Takt Time
Takt time is the heartbeat of a manufacturing operation.
It is the amount of time that elapses between successive production units. In other words, it is the rate at which products must be produced in order to meet customer demand. Takt time is calculated by dividing the available production time by the number of units of product demanded by customers.
Takt time is an important metric because it sets the pace of production and helps to ensure that customer demand is met.
It also provides a way to measure and improve productivity.
Takt time = Available working time per shift / rate of customer
8. Inventory Turnover
Inventory turnover measures how often a company sells and replaces its inventory. A high inventory turnover indicates that a company sells its products quickly and efficiently.
Average inventory / cost of goods sold x 365
These are just a few of the important KPIs that manufacturers should track. By tracking these KPIs, you can identify areas for improvement in your manufacturing process and make necessary changes to increase efficiency.

How to use analytics in manufacturing?
There are five essential steps to creating a manufacturing analytics pipeline that can help improve your manufacturing business performance.
Understanding and applying these steps can increase your overall productivity and efficiency. Do not hesitate to contact a professional data analytics company if you need assistance in any of these steps. Creating a data analytics pipeline is an important investment for your business that can bring many benefits.
Step 1:
The first step in data analytics in manufacturing is to ingest the data from the data source. This can be done manually or through an automated process. Once the data is ingested, it can be processed and analyzed to help solve various manufacturing-related issues.
Step 2:
Now that you have collected all the data, it is time to process and enrich it, so your downstream system can utilize it in the format it best understands.
This is where data analytics in manufacturing comes into play.
There are multiple ways to process and enrich data. One way is to use a tool like Excel to manually clean up the data and then import it into your system. This can be time-consuming and may not be the most accurate method.
Another way is to use a real-time manufacturing analytics tool that can automate the process and ensure accuracy. This is the recommended method as it will save you time and effort in the long run.
Once the data is processed and enriched, it can be imported into your downstream system for further analysis.
Step 3:
Storing data in a data warehouse or data lake is an important step to keep the data safe and secure for long-term archival or reporting and analysis.
There are many benefits of using a data warehouse or data lake, such as:
- Improved security — Security features, such as encryption and access control, can help protect your data from unauthorized access
- Increased reliability — Data warehouses and data lakes are designed to be highly available and scalable, so you can trust that your data will be available when you need it
- Flexibility — Flexible query and analysis options, so you can easily adapt your reporting and analysis to changing needs
- Enhanced performance — Due to their columnar storage format and use of indexes
- Lower costs — Save money by reducing the need for expensive hardware and manufacturing analytics software licenses
If you are considering using a data warehouse or data lake for your business, there are a few things to keep in mind:
- Choose the right platform — Different data warehouse and data lake platforms are available, so it’s important to choose the one that best meets your needs
- Plan for growth — Data warehouses and data lakes can grow quickly, so it’s important to plan for future capacity needs
- Consider your use cases — Before choosing a platform, determine what you want to use the data warehouse or data lake. This will help you select the platform that best meets your needs
- Get help — If you’re struggling to get started, there are many resources available to help you, including books, online courses, and consulting services
Step 4:
After you’ve collected and organized your manufacturing data, it’s time to analyze it.
Using big data for machine learning analytics in manufacturing can help you find trends and patterns in your manufacturing and identify areas where improvements can be made. Various manufacturing analytics tools are available, so you’ll need to choose the one that best meets your needs. Once you’ve selected an analytics tool, you’ll need to feed your manufacturing data into the tool and start analyzing.
Some things you may want to look for include:
- Trends in production rates
- Changes in quality over time
- Identification of bottlenecks
- Opportunities for process improvement
By investigating your manufacturing data analytics, you can gain valuable insights that can help you improve your business performance.
Step 5:
Now that you have collected and processed your data, it’s time to start using machine learning for predictive analytics manufacturing.
Depending on what you want to achieve, you may need to use different techniques. For example, if you want to do demand forecasting for your products, you might use a regression model. If you want to understand which factors are most important for determining customer satisfaction, you might use a decision tree.
Once you’ve decided on the appropriate technique, you’ll need to train your model on historical data.
This will allow the model to learn patterns and relationships that can be applied to new data. After the model is trained, you can start using it to make predictions or generate reports.

How is ERP analytics changing the manufacturing industry?
ERP analytics provides manufacturers with a new level of insight into their businesses.
By collecting and analyzing data from all aspects of the manufacturing process, ERP analytics is helping manufacturers to identify inefficiencies and optimize operations.
In the past, most manufacturers relied on trial and error to improve their processes. This was often time-consuming and costly, with little guarantee of success. With ERP analytics, manufacturers can now quickly and easily identify areas that need improvement and make changes accordingly.
ERP analytics is also helping manufacturers to understand their customers’ needs better. By analyzing customer data, manufacturers can tailor their products and services to meet customer demand more effectively.
The benefits of ERP manufacturing business analytics solutions are clear — it helps manufacturers to save time and money while also improving customer satisfaction.
As the manufacturing industry continues to become more competitive, ERP analytics will play an increasingly important role in helping manufacturers to stay ahead of the curve.
How analytics can be used to drive more effective business decisions around additive manufacturing?
There is no doubt that additive manufacturing (AM) is a disruptive technology that is transforming the electronics industry. By enabling on-demand production, AM allows manufacturers to produce components that were never before possible and reduce order-to-cash cycle time. But as with any new technology, there is a learning curve involved in understanding how best to leverage it for maximum business benefit.
Here are some key areas where analytics can help drive more effective decision-making:
- Understanding the cost benefits of switching from traditional manufacturing processes to AM
- Long-term cost savings associated with AM – such as reduced lead times and inventory costs
- Understanding the impact of AM on your company’s supply chain
- Optimize your use of AM by understanding which types of parts are best suited for production via AM
By leveraging analytics to drive more effective decision-making around additive manufacturing, you can ensure that your company can capitalize on this transformative technology fully.
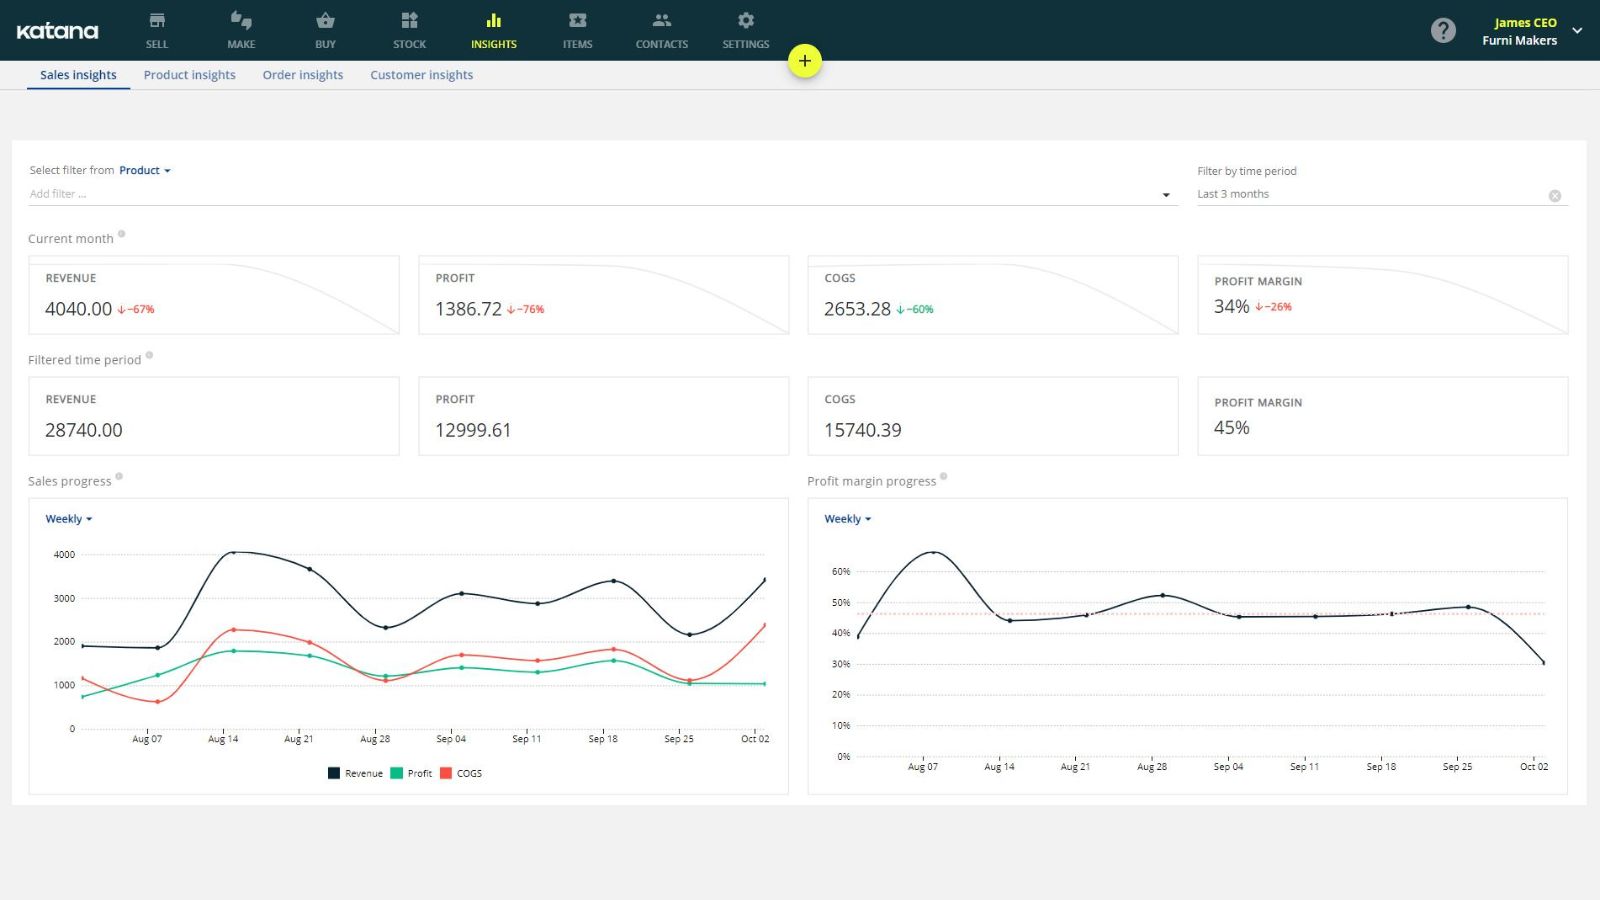
Katana for analyzing your businesses performance
Katana gives you a live look at your manufacturing business and the tools to analyze your operations for improved resource allocation and production planning.
Katana comes equipped with the Insights dashboard — giving you the manufacturing analytics you need for complete visibility and control over all the moving parts of your business. Best of all, Katana integrates with your favorite business tools, meaning you have data from multiple sales channels, locations, and periods all accessible in one place without the need for implementing another Business Intelligence tool. Using Katana, you can easily track:
- Sales performance
- Revenue, profit, and cost
- Profitability margins
- Sales trends and risks for reprioritizing items
- And more
Get a demo and get invaluable manufacturing analytics at your fingertips.
And there you have it, everything you need to know about analytics for manufacturing. If you have any questions about data tracking in manufacturing, then please don’t hesitate to reach out to us. And until next time, happy analyzing.
Get inventory trends, news, and tips every month
Explore all categories
Get visibility over your sales and stock
Wave goodbye to uncertainty with Katana Cloud Inventory — AI-powered for total inventory control
