A guide to inventory analysis for manufacturing
Starting a manufacturing business is one thing, but scaling it is entirely different.
Instead of fulfilling a few orders for a product, you make at home or in a small facility, you now need to juggle the demands of multiple customers, a larger inventory, and perhaps even employees.
To keep things running smoothly, you’ll need to track your inventory levels closely and make decisions accordingly. That’s where inventory analysis comes in. By analyzing your inventory data, you can better decide what to produce, how much, and when to produce it.
In this guide, we’ll cover the basics of inventory analysis for manufacturing businesses by examining the definition, benefits, and methods you can use to get started.
What is inventory analysis?

Inventory analysis is the process of reviewing your inventory data to understand it better and make more informed decisions about your manufacturing business.
This can include demand forecasting, optimizing safety stock levels, and learning when’s the best to order (or reorder) additional materials.
You can use many different methods to analyze your inventory data, but some common ones include:
- Trend analysis
- ABC analysis
- Economic order quantity (EOQ) analysis
We’ll take a closer look at those and more but first, let’s consider some of the advantages achieved by analyzing your inventory.
Benefits of inventory analysis
Many benefits come with analyzing your inventory data, but here are a few of the most important ones:
- Make better decisions — By understanding what products are selling well and which aren’t, you can adjust your production accordingly. This can help you save money on inventory that isn’t moving and increase profits by focusing on items in high demand
- Reduce the risk of stock-outs — No one wants to run out of a product their customers want to buy. Recent data suggests that 37% of customers will go to another brand if they experience a stock-out. By correctly analyzing your inventory, the chance of these disasters will be minimized
- Save money on storage and shipping costs — Carrying too much inventory can be costly, both in terms of the physical space it takes up and the money you spend shipping it from one location to another. By analyzing your inventory data, you can better understand how much inventory you need to keep on hand
- Save time — Tracking your inventory manually can be time-consuming and error-prone. But if you use software, you can automate many of the tasks involved in inventory management analysis and free up your time, so you can focus on other aspects of running your business
- Improve customer satisfaction — If you have a good handle on your inventory levels, you’re more likely to be able to fulfill customer orders on time. This can lead to happier customers and improved customer satisfaction
There are several others, like reduced waste, more accurate supplier performance, and the ability to plan for future growth. But these are some of the most impactful benefits of conducting inventory analysis.
Types of inventory
When breaking inventory into sub-categories, there are four major types:
Each type of inventory has unique characteristics, which means each requires different methods for analysis and management. Here’s a brief overview of each category.
Raw materials
Raw materials are the unprocessed inputs used in your manufacturing process. This can include everything from lumber and steel to chemicals and oil.
Since raw materials are the foundation of your product, it’s essential to keep close track of how much you have on hand at all times. You don’t want to run into a situation where you’re unable to complete an order because you’re waiting on a shipment.
It’s also important to monitor trends in the prices of raw materials. For example, if steel prices start to rise, you’ll need to adjust your budget and pricing accordingly. Similarly, supply chain disruptions can impact availability, so it’s important to be aware of potential risks.
Work-in-progress (WIP)
The next stage is work-in-progress (WIP), which refers to products that have been started but are not yet finished. In other words, these are products that are in the process of being manufactured.
WIP inventory is often more difficult to manage than raw materials or finished goods because it’s hard to know how long each product will take to complete. This can make forecasting difficult and can lead to issues with cash flow if you’re not careful.
Finished goods
Finished goods are products that have been completed and are ready to be sold. This is the inventory you’ll sell to your customers or use to fulfill orders.
Ideally, your finished goods inventory will always be at a level where you can meet customer demand but not so high that you’re tying up too much capital in stock. This can be a fine balance to strike, but it’s important to get it right.
If you have too many finished products, you’ll have to pay to store them somewhere. And if you don’t have enough, you risk missing out on sales or having to turn away customers.
Maintenance, repair, and operations (MRO)
Maintenance, repair, and operations (MRO) inventory includes all the items you need to keep your facility running smoothly. This can include:
- Tools
- Replacement parts
- Cleaning
- Office supplies
Since MRO inventory is not directly related to your manufacturing process, it can be easy to overlook. However, having sufficient MRO inventory is essential for keeping your business running smoothly and avoiding disruptions.
How to analyze inventory
Walking around and randomly counting your products by hand would qualify as inventory analysis, but it certainly isn’t a method you want to rely on for making decisions about your business. Instead, you’ll want to use a more systematic approach that can give you reliable and actionable insights into your inventory data.
There are two main types of inventory analysis:
- Quantitative methods involve collecting numerical data about your inventory levels and then using mathematical formulas and models to analyze that data. This is the most common type of inventory analysis as it tends to be the most accurate
- Qualitative methods are more subjective and focus on understanding the reasons behind your inventory data instead of just the numbers themselves. This can help put your quantitative findings into context and make decisions about complex issues that can’t be easily quantified
Let’s take a closer look at some of the quantitative inventory analysis methods so that you can get started.
ABC analysis
One of the most common methods of inventory analysis is ABC analysis. It is a method of classifying inventory items based on their importance. The three categories are:
- A items — These are the items with the highest monetary value and make up a small portion of your inventory (~10-20%)
- B items — These are not as important as A items but still make up a significant portion of your inventory (~20-30%)
- C items — These are the least important items in your inventory but make up the majority of it (~50-70%)
ABC analysis is a helpful way to prioritize your inventory and make sure you always have enough of the most important items in stock.
However, it’s important to note that ABC classification is not static.
As your business grows and changes, the importance of certain inventory items may also vary. It’s a good idea to periodically review your ABC classification to ensure it still makes sense.
VED analysis
VED is an inventory analysis example that categorizes products into three designations:
- Vital products are those that are essential to your business and cannot be out of stock for long without causing major disruptions
- Essential products are important but can be out of stock for short periods without causing too much disruption
- Desirable products are nice to have but aren’t essential and can be out of stock for extended periods without impacting your business too much
Categorizing your products in this way can help you make better decisions about which products to keep in stock at all times, which ones to order more of when they start to run low, and which ones you can afford to be out of stock (for a time).
SDE analysis
SDE analysis is a quantitative method used to examine how difficult it is to acquire or produce a product. They are broken into three categories:
- Scarce products that are difficult to find or produce
- Difficult products that are not as scarce but still require a lot of effort to acquire or produce
- Easy products that are readily available and don’t require much effort to acquire or produce
Procurement can be an incredibly challenging process, especially for products that are scarce or difficult to obtain. SDE analysis can help you understand which products will be the most challenging to procure so that you can plan accordingly.
Economic order quantity (EOQ)
EOQ is one of the most common quantitative inventory analysis methods used to determine the optimal order quantity for a product. This includes taking into account the fixed costs associated with ordering (e.g., shipping and handling) as well as the variable costs associated with holding inventory (e.g., storage).
The goal of EOQ is to find the order quantity that minimizes the total cost of ordering and holding inventory. This can be a difficult balance to strike, but using EOQ can help you find the sweet spot for your business.
To calculate it, you will need the following formula:
Q = √[2(DK/H)]
Where:
- Q = Optimal order quantity
- D = Customer demand
- K = Order cost
- H = Holding (carrying) cost
Critically, EOQ is not a perfect model, and it doesn’t take into account all the complexities of real-world inventory management. For instance, a company with a wide variance in demand (like a seasonal business) will likely not find EOQ to accurately represent its inventory needs.
While it can be a useful addition to your analysis, it shouldn’t stand alone.
Improving your inventory analysis
One of the biggest issues companies have when trying to conduct inventory analysis is data collection and organization. If they are keeping track of their inventory levels manually, it can be difficult to get accurate and timely information. This is why many businesses invest in inventory management software.
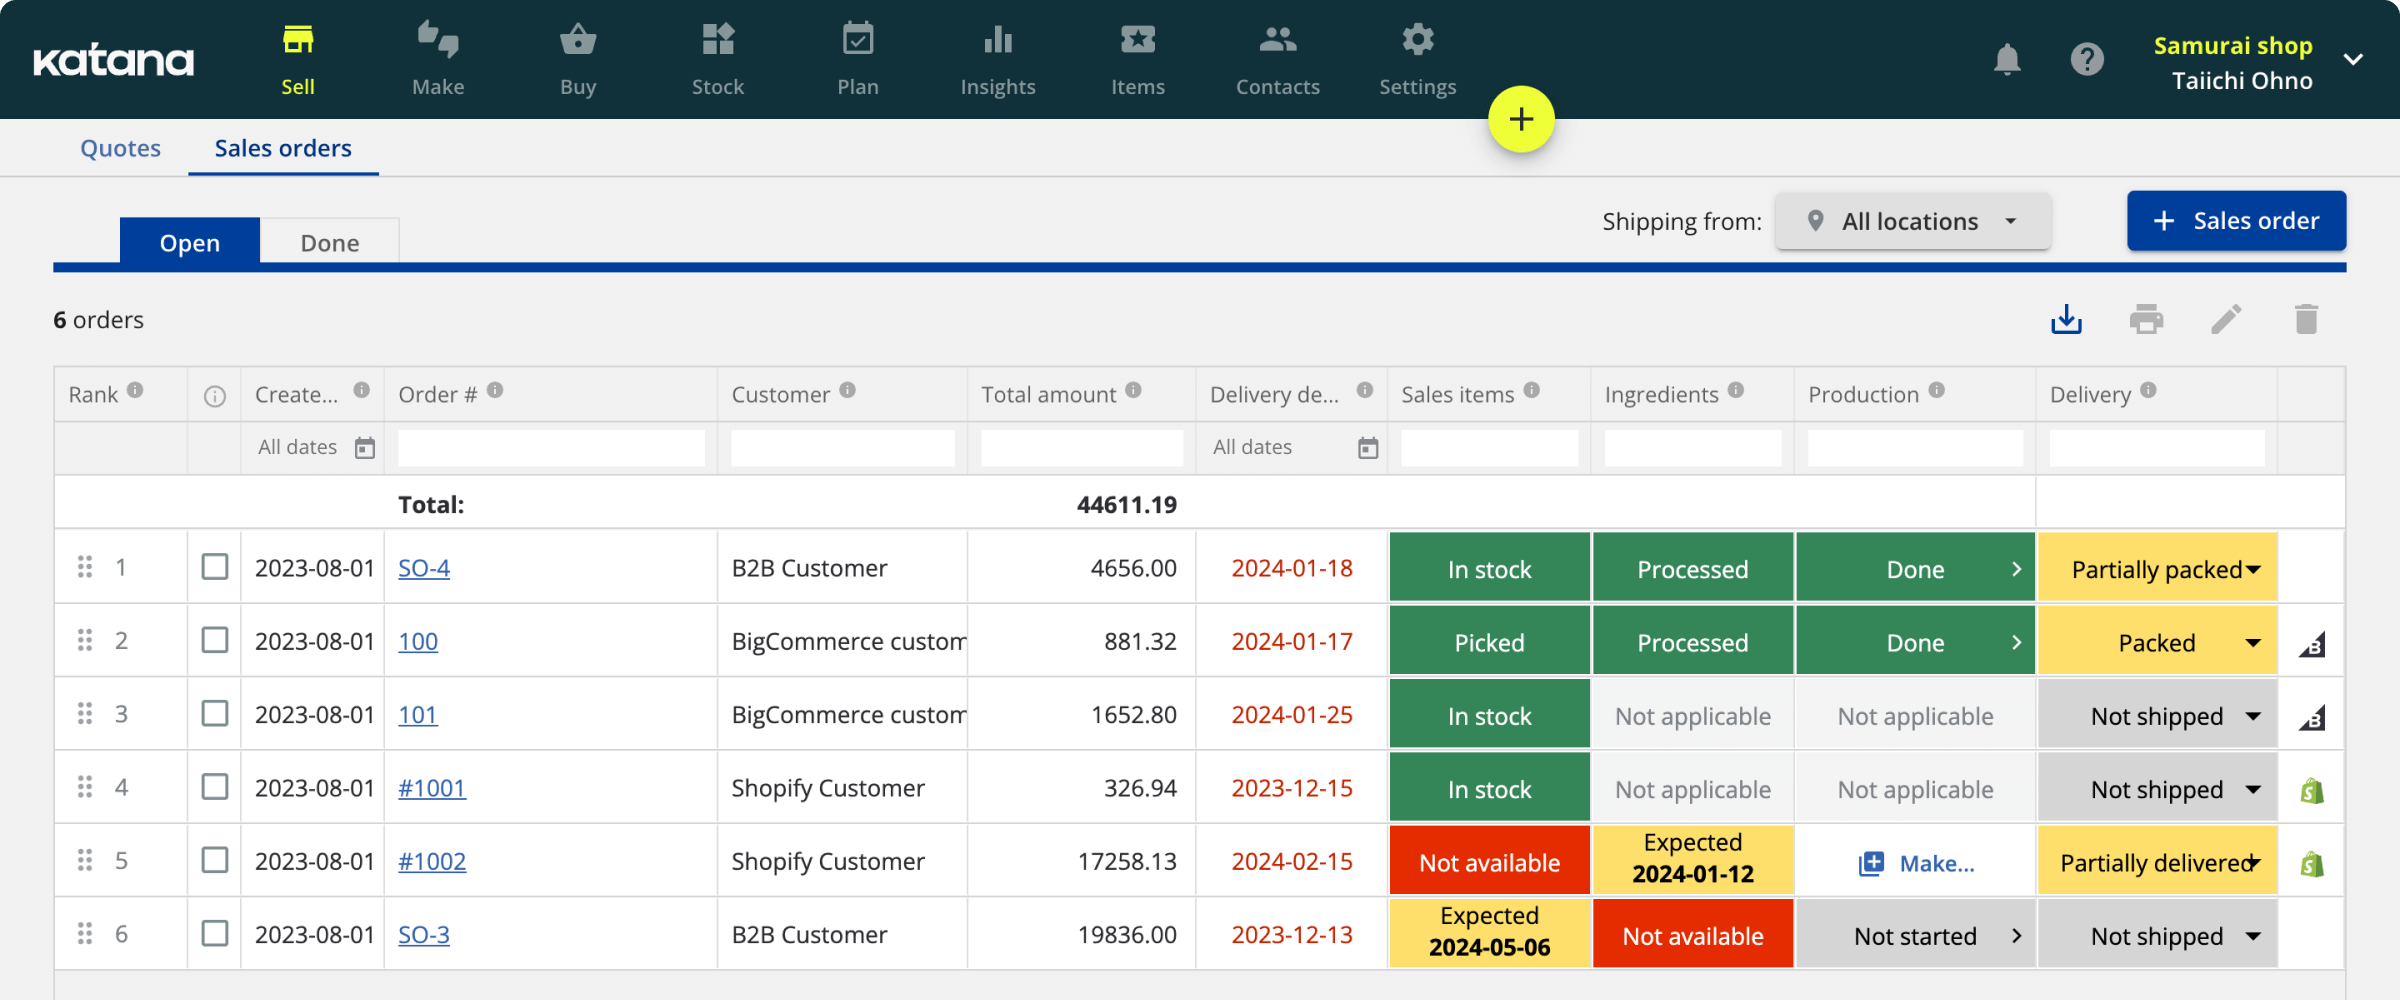
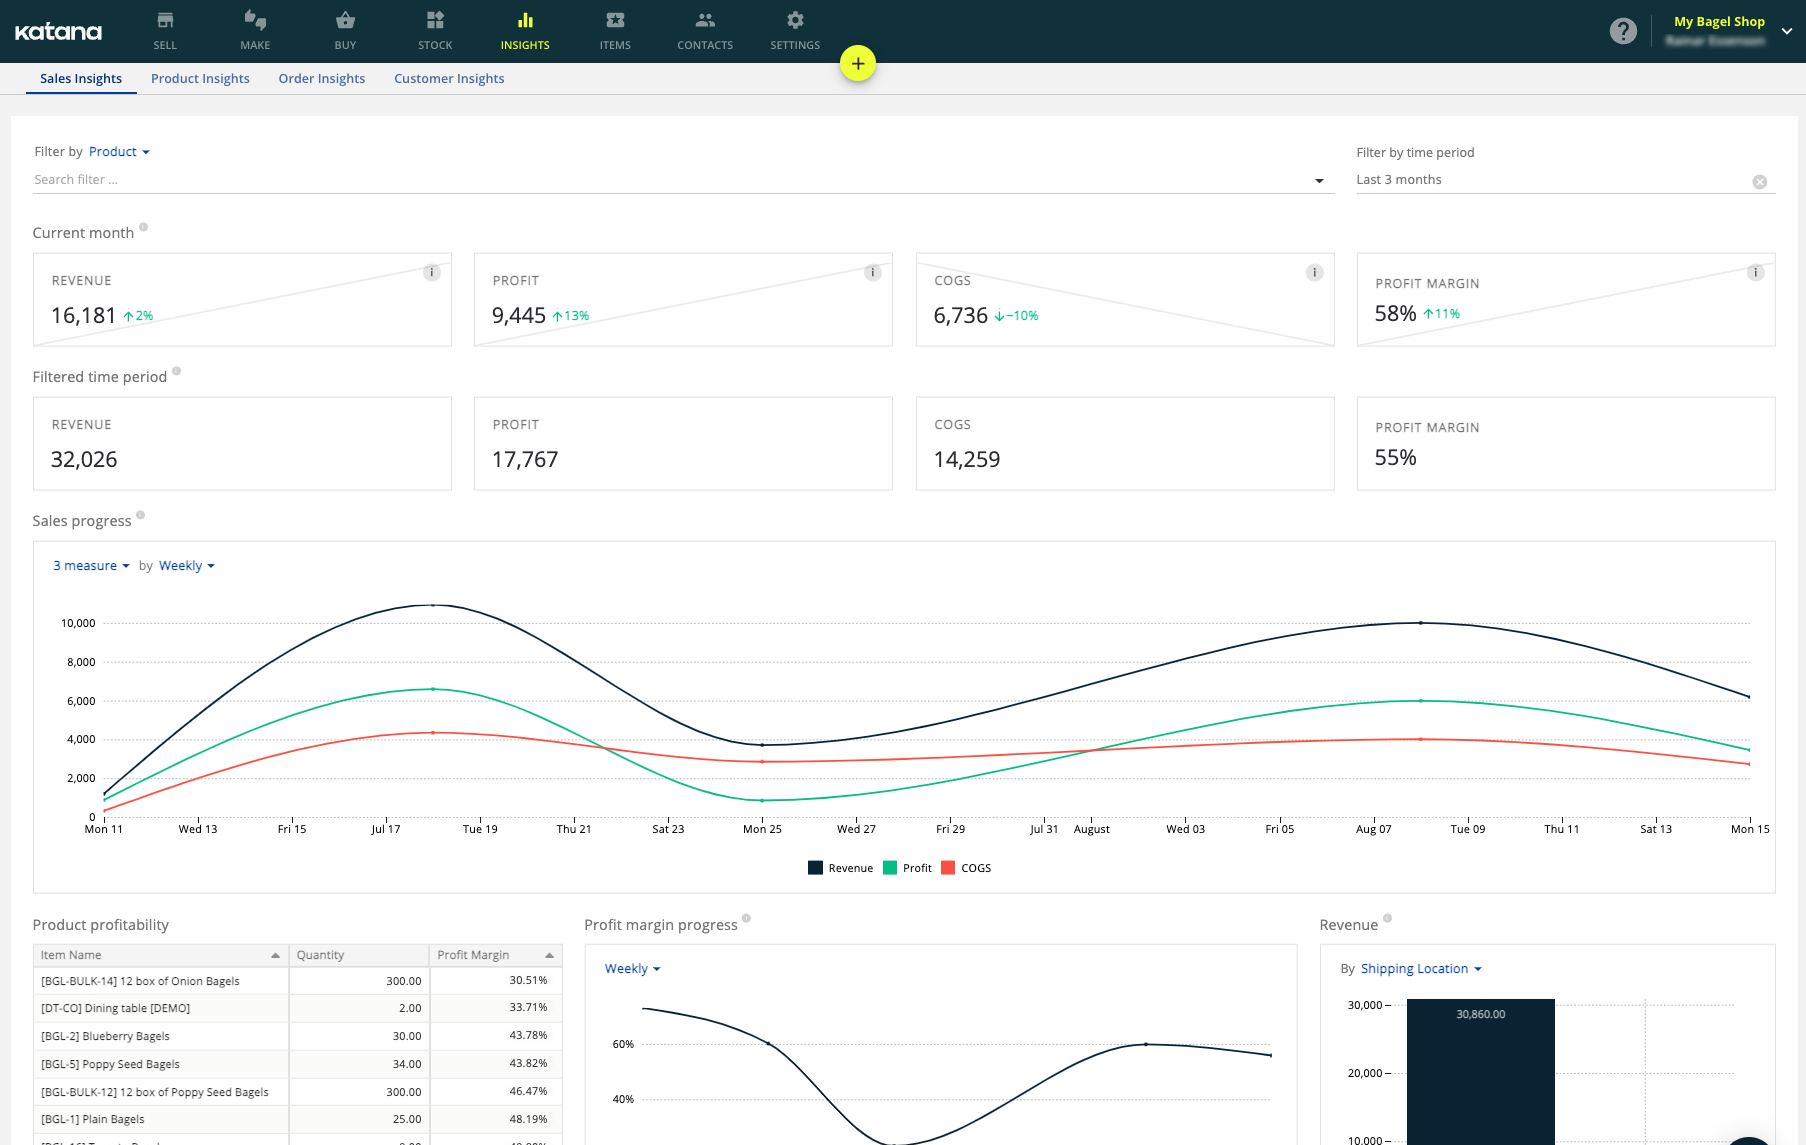
Inventory management software gives you a centralized place to track your inventory levels, orders, and sales data. This not only makes it easier to collect accurate data but also makes it easier to organize and analyze that data.
Katana provides real-time insights into your inventory levels, helps you track and manage orders, and even integrates with dozens of other software solutions to provide an end-to-end view of your manufacturing business.
To learn more about how Katana can help you with inventory analysis, book a demo with us to learn more.
More from Katana


Get visibility over your sales and stock
Wave goodbye to uncertainty by using Katana Cloud Inventory for total inventory control