Inventory forecasting to prepare for the rainy days
When you plan a trip abroad, you will likely look at the weather forecast to ensure you don’t have to spend two weeks in your hotel room, watching foreign TV and eating pot noodles because it’s raining outside.
Forecasting in inventory management is at least as important in the business world. Your employees and customers will even care more about your inventory than your holiday.
Incorrectly forecasting your inventory may cause you to be stuck with a room full of unsold products or, even worse, drive customers away who are willing to pay top dollar for your goods since you have nothing in stock.
To make sure this doesn’t happen, we’ve compiled the ultimate guide to inventory forecasting, so sit back, grab your favorite beverage, and keep reading.
What is inventory forecasting?
Inventory forecasting is a process used to predict future inventory requirements. Also known as demand planning or demand forecasting, it involves analyzing past sales trends, production rates, and other relevant data to estimate the amount of inventory needed to meet customer demand without overstocking or running into shortages. The goal is to maintain optimal inventory levels, making sure that products are available when customers want them while minimizing inventory holding costs.
There are multiple methods for forecasting inventory, ranging from simple heuristic models to complex statistical and machine learning algorithms. These methods can be broadly categorized into qualitative and quantitative approaches.
Qualitative methods often rely on expert judgment and market research, while quantitative methods use historical data to predict future trends. Each method has its unique strengths and weaknesses, and the choice of method can significantly impact the accuracy of the forecasts and the efficiency of inventory management.
In the following sections, we’ll explore these methods in more detail, discussing how they work and when they are most effectively applied. Understanding this will equip businesses to make informed decisions about inventory management, ultimately contributing to better customer satisfaction and financial performance.
The goal of inventory forecasting
As we briefly mentioned, the goal of inventory forecasting is to accurately predict future demand so that businesses can have the right amount of stock on hand at all times. This helps to avoid both stockouts and excess inventory, which can tie up capital and increase storage costs.
Inventory forecasting helps companies plan ahead, making sure they have the products their customers want when they want them. It’s also necessary to minimize obsolete inventory, as your forecasts can show diminishing demand before you would notice it otherwise.
Customers have more choices now than ever, so an empty shelf may propel them towards a competitor without a second thought. With the help of stock forecasting, businesses can keep their shelves stocked and their customers happy. It also ensures companies order what they can actually sell and don’t get stuck with mountains of fidget spinners or the like that nobody wants anymore.
Benefits of accurate inventory forecasts
Before we scare you away with the time-consuming and sometimes expensive methods of forecasting inventory, let’s take a step back and look at the benefits of accurate inventory forecasts.
Improved customer satisfaction
Your customers are putting the bread on your table, so it’s no wonder their satisfaction is at the top of the list.
If your customers can’t find the products they need when they need them, they won’t be sticking around for very long. While some may come back at a later date to see if you’ve filled your empty shelves, others may never give you a second chance and will do their shopping with your competitor instead. For a business, it’s a lot easier and cheaper to keep a loyal customer than it is to gain a new one, so you should always take care of them first.
You can avoid stockouts and keep your customers happy with accurate inventory demand forecasting. By stocking the products your customers want when they want them, you can keep benefitting from their repeat business.
Reduced costs
While accurate inventory demand forecasting may require some upfront investment, it can save your business money in the long run.
Holding too much inventory gets costly, as every product you hold incurs a carrying cost, which includes the cost of warehouse space, labor, packaging, and insurance. Reducing the amount of inventory you need to store will, therefore, reduce your carrying costs. On the other hand, holding too little inventory can also be costly. If you run out of a product that your customers want, you may lose their business entirely. In some cases, you may even have to pay expedited shipping costs to get more products in stock quickly.
In addition, if you can forecast inventory needs accurately, you can take advantage of quantity discounts suppliers offer. Buying products in bulk can save your business money, which can offset the cost of forecasting inventory.
By using inventory forecasting, you can find the sweet spot between too much and too little inventory, saving your business money in the long run.
Improved cash flow
Another benefit of accurate inventory forecasting is improved cash flow. If you carry too much inventory, you tie up capital that could be used for other purposes, such as investing in new products or marketing campaigns. You can free up this cash with accurate inventory demand forecasting and put it to work elsewhere in your business.
On the other hand, if you don’t have enough inventory on hand to cover all the demand, you may have to borrow money to cover the cost of new inventory. This can lead to increased debt and higher interest payments, which can strain your business’ finances.
Increased sales
If customers know that you always have the products they need in stock, they are more likely to buy from you instead of going to a competitor. In addition, being able to meet customer demand can lead to increased sales, as customers are more likely to buy additional items when they’re already in your store or browsing your website.
Now that you’re aware of the benefits, let’s learn how to forecast inventory with different methods. These may seem complex and resource-heavy, but the benefits will definitely outweigh the costs when implemented correctly.
Inventory forecasting methods
There are a lot of different methods for inventory forecasting. Most of them fall under qualitative or quantitative approaches, where quantitative means data, numbers, statistics, and more math than you know what to do with, and qualitative means asking people. So, whichever way you lean, you should be able to find a method that suits best for you. However, for the most accurate results, you should still pick a method from the other group as well.

Quantitative methods
Quantitative methods are mathematical and statistical techniques used to analyze data.
These methods can be used to describe, predict, and understand relationships between variables. There are many different types of quantitative methods, but they all have one thing in common — they make use of numerical data. This means that quantitative methods are particularly well suited for analyzing inventory data.
Let’s go over some of them and see how you can implement them in your forecasting.
Trend analysis
One popular quantitative method is trend analysis. This approach looks at past sales data to identify whether demand increases, decreases, or stays the same. This information can then be used to predict future inventory needs. You need your sales data for the period to conduct a trend analysis. This data can be gathered from historical sales records or other sources. Once you have this data, you can begin to identify trends.
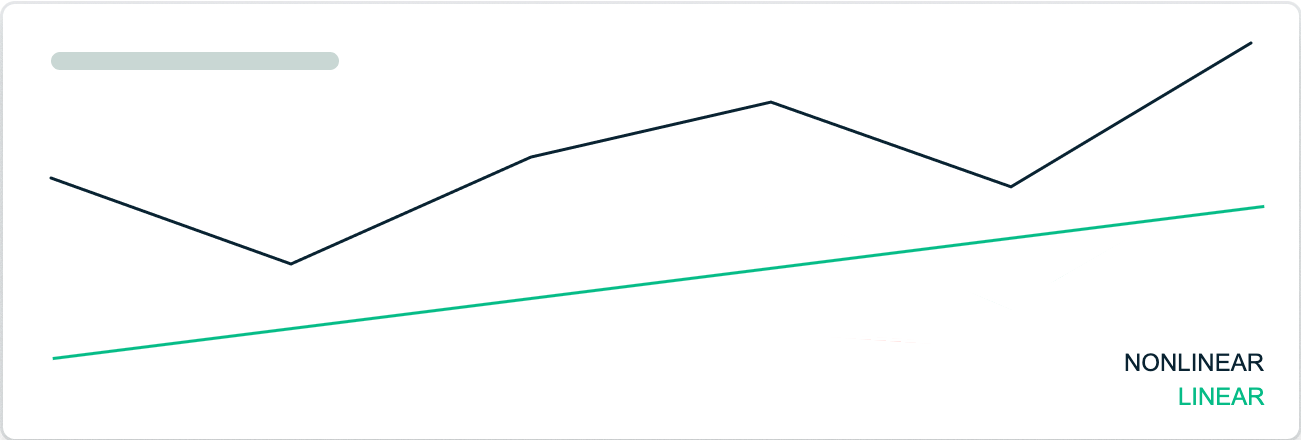
There are two types of trends that you can look for:
- Linear trend — A linear trend is a straight line. Linear trends can be positive, negative, or flat. A positive linear trend means that the demand is increasing over time. A negative linear trend means that the demand is decreasing over time. And a flat trend means there’s no distinguishable trend over the given period.
- Nonlinear trend — A nonlinear trend is any trend that is not a straight line. Nonlinear trends can be caused by a number of factors, such as changes in the market or the introduction of new products.
Once you have identified the type of trend, you can begin to predict future changes in the variable. To do this, you can use trend lines. A trend line is a line that is drawn on a graph to show the direction of a trend.
There are two types of trend lines:
- A moving average trend line — Created by averaging the data points over a specific period. This type of trend line is often used to smooth out fluctuations in the data.
- A regression trend line — Created by using a statistical technique called regression analysis. This type of trend line is more accurate than a moving average trend line, but it is also more complex to create.
In the case of messy data, identifying the trend can be quite hard. To make it easier, you can use moving averages.
To determine a trend, you can add two moving averages together, one for a shorter period of time and one for a longer period. The difference between the two moving averages will tell you if the trend is increasing, decreasing, or staying the same:
- Increasing trend — The longer moving average is higher than the shorter moving average
- Decreasing trend — The shorter moving average is higher than the longer moving average
- No trend — The two moving averages are equal
Once the trend type has been identified, you can use historical sales data to predict future demand. For example, if you believe demand will continue to increase, you can order more inventory. If you believe demand will decrease, you can order less inventory.
There are several advantages to using trend analysis:
- Relatively simple method that doesn’t require a lot of data
- Can be used to predict both short-term and long-term demand
- Can help to identify changes in demand over time, which can help businesses adjust their inventory levels accordingly
However, there are also some drawbacks to using trend analysis:
- Only looks at historical data, so it can’t account for changing market conditions
- Can be difficult to identify the correct trend type
- May not be accurate if there are sudden changes in demand
Regression analysis
Another quantitative method is regression analysis.
This approach uses historical sales data to identify relationships between different factors, such as price, promotions, and seasonality. This information can then be used to predict how changes in these factors will impact future demand.
Regression analysis is a more complex method than trend analysis, but it can be more accurate. This is because it can take into account multiple factors that might impact demand.
As to not get too technical, we’ll briefly steer away from inventory management. However, be warned, there will be some math ahead.
Let’s imagine that we need to predict a person’s weight based only on their height. Luckily, we can recall the statistics class when we learned about linear regression, so we confidently take on the task given.
We are given collected data containing weights and heights of 100 people. We can use linear regression analysis to find the line of best fit for this data. Let’s say that the equation for the line of best fit is y = 2.5x + 30. This equation means that, for every 1 unit increase in height, the weight will increase by 2.5 units.
Now, let’s say that we need to estimate the weight of a person who is 70 inches tall. We would do the following calculations:
y = 2.5x + 30
y = 2.5 x 70 + 30
y = 175 + 30
y = 205 pounds
This calculation tells us that a person who is 70 inches tall weighs 205 pounds. Of course, this is just an estimate, and the actual weight could be different. However, this example shows how linear regression can be used to predict future values.
In general, linear regression analysis is a powerful tool that can be used to estimate the value of one variable based on the values of another variable.
The advantages of regression analysis:
- Can be used to identify relationships between different factors
- Can help to predict how changes in these factors will impact demand
- Can be used to identify potential problems before they occur
Some cons to using regression analysis:
- Can be time-consuming and expensive to collect all of the data needed for the analysis
- Can be difficult to identify the correct relationships between different factors
- Can be inaccurate in case there are sudden changes in demand
Qualitative methods
Qualitative methods are based on intuition, experience, and opinion. They are often used when historical data is unavailable or when there are significant changes in the business, such as a new product launch.
Qualitative methods used in inventory forecasting involve analyzing customer behavior, fashion trends, and other factors that can affect demand. This information is then used to make predictions about future demand. This type of forecasting is often used in conjunction with quantitative methods to get a more accurate picture of future demand.
The Delphi technique
One popular qualitative method is the Delphi technique. The Delphi technique is a method used to estimate the likelihood of future events, in our case — future customer demand.
This method is used when there is little or no information about the event. The Delphi technique is used by a panel of experts who make their predictions anonymously. This anonymity allows the experts to feel free to give their true opinions without fear of being wrong or ridiculed.
The panel of experts is given a set of questions about the event, and each expert answers the questions independently. The responses from the experts are then compiled and analyzed. From this analysis, a consensus forecast is generated.
The Delphi technique has been found to be quite accurate in forecasting future events. In fact, it has been found to be more accurate than other methods, such as surveys, that try to estimate the likelihood of future events.
The benefits of using the Delphi technique are:
- Can be used when historical data is not available
- Can help to identify changes in demand
- Provides consensus from a group of experts
Drawbacks to using the Delphi technique:
- Can be time-consuming and expensive to assemble a panel of experts
- The experts may disagree on their estimates
- Can be biased and subjective
Market research
Market research is the process of collecting and analyzing data about customers, markets, and competitors. This information can be used to understand customer needs and wants and identify opportunities and threats.
Market research can be conducted in a number of ways, such as surveys, focus groups, interviews, and observation.
- Conducting surveys — A great way to gather quantitative data about consumer behavior and preferences. This data can be used to generate demand forecasts.
- Interviews and focus groups — Can be used to gather qualitative data about consumers’ perceptions and attitudes. This data can be used to understand how changes in the marketplace might impact demand for your products.
- Data from secondary sources — Using government statistics or industry reports can also be helpful in forecasting demand. This data can provide insight into larger trends that might impact the demand for your products.
Advantages of using market research:
- Can be used to gather information about customer needs and wants
- Can be used to identify changes in demand
- Can help generate new ideas for products or services
Disadvantages of using market research:
- Time-consuming and expensive to conduct surveys or focus groups
- The results may not be representative of the entire market
- The information gathered may be subjective and biased
Now, to get the most accurate inventory forecast, you should use a combination of both quantitative and qualitative methods. This will help account for changes in the market and customer needs and provide a more complete picture of future demand.
Inventory forecasting formula
If you came looking for a single formula that will yield the most accurate inventory forecasts known to man, you’re unfortunately out of luck. Not because we weren’t able to find it but rather because an inventory forecasting formula like that doesn’t exist. There is no one-size-fits-all formula. The most appropriate method or combination of methods will depend on the business and available data. Though we understand that’s not what you want to hear, so there are some general guidelines you can follow.
Before we take a look at the calculations, let’s go over some terminology:
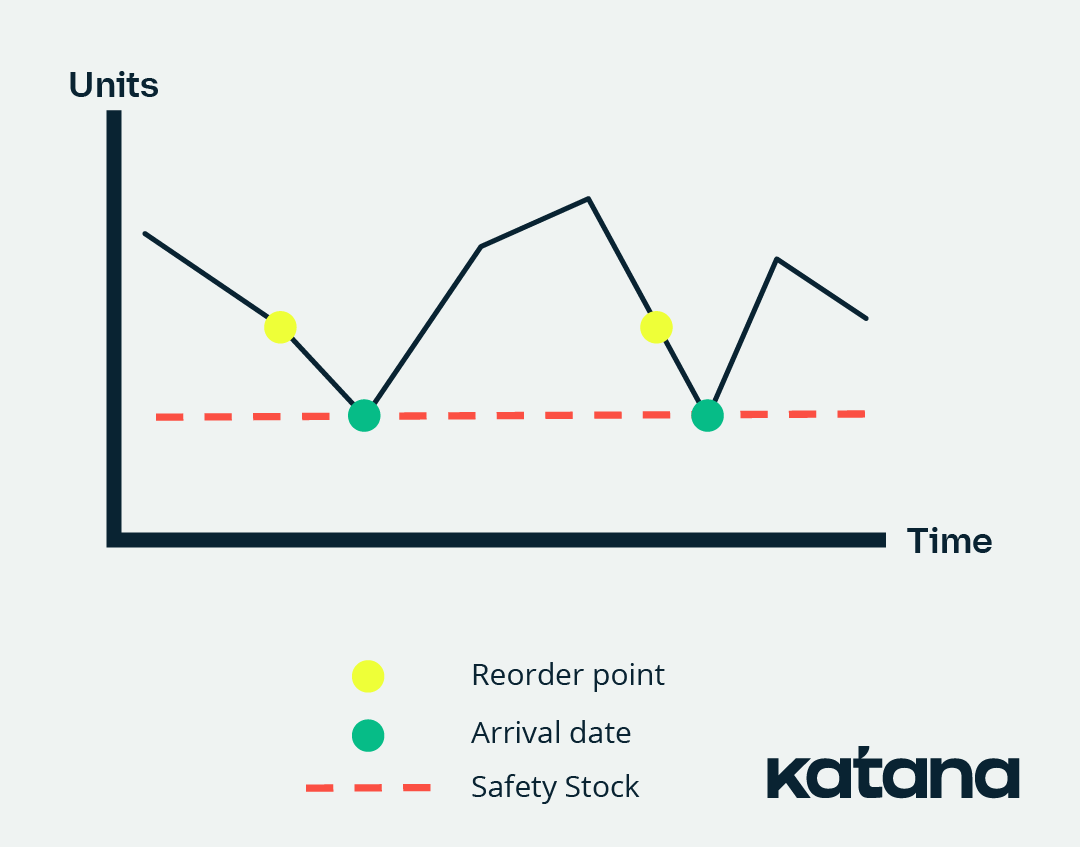
- Reorder point — The minimum inventory level at which a new order should be placed
- Lead time — The amount of time it takes to receive a new shipment after an order
- Average daily demand — The average number of units sold per day
- Safety stock — The extra inventory kept on hand to meet unexpected spikes in demand
Now that we’ve got that out of the way, let’s dive into the formulas.
Two main formulas are used in inventory forecasting:
- The reorder point formula
- The safety stock formula
Let’s go over both of them.
Reorder point formula
The reorder point formula is used to calculate the minimum inventory level at which a new order should be placed. It takes into account the average daily demand and the lead time.
Reorder point = Average daily demand x lead time + safety stock
For example, let’s say a business has an average daily demand of 10 units and a lead time of 5 days. If they want to maintain a safety stock of 50 units, their reorder point would be:
Reorder point = 10 x 5 + 50
Reorder point = 100
This means that the business should place a new order when its inventory level reaches 100 units.
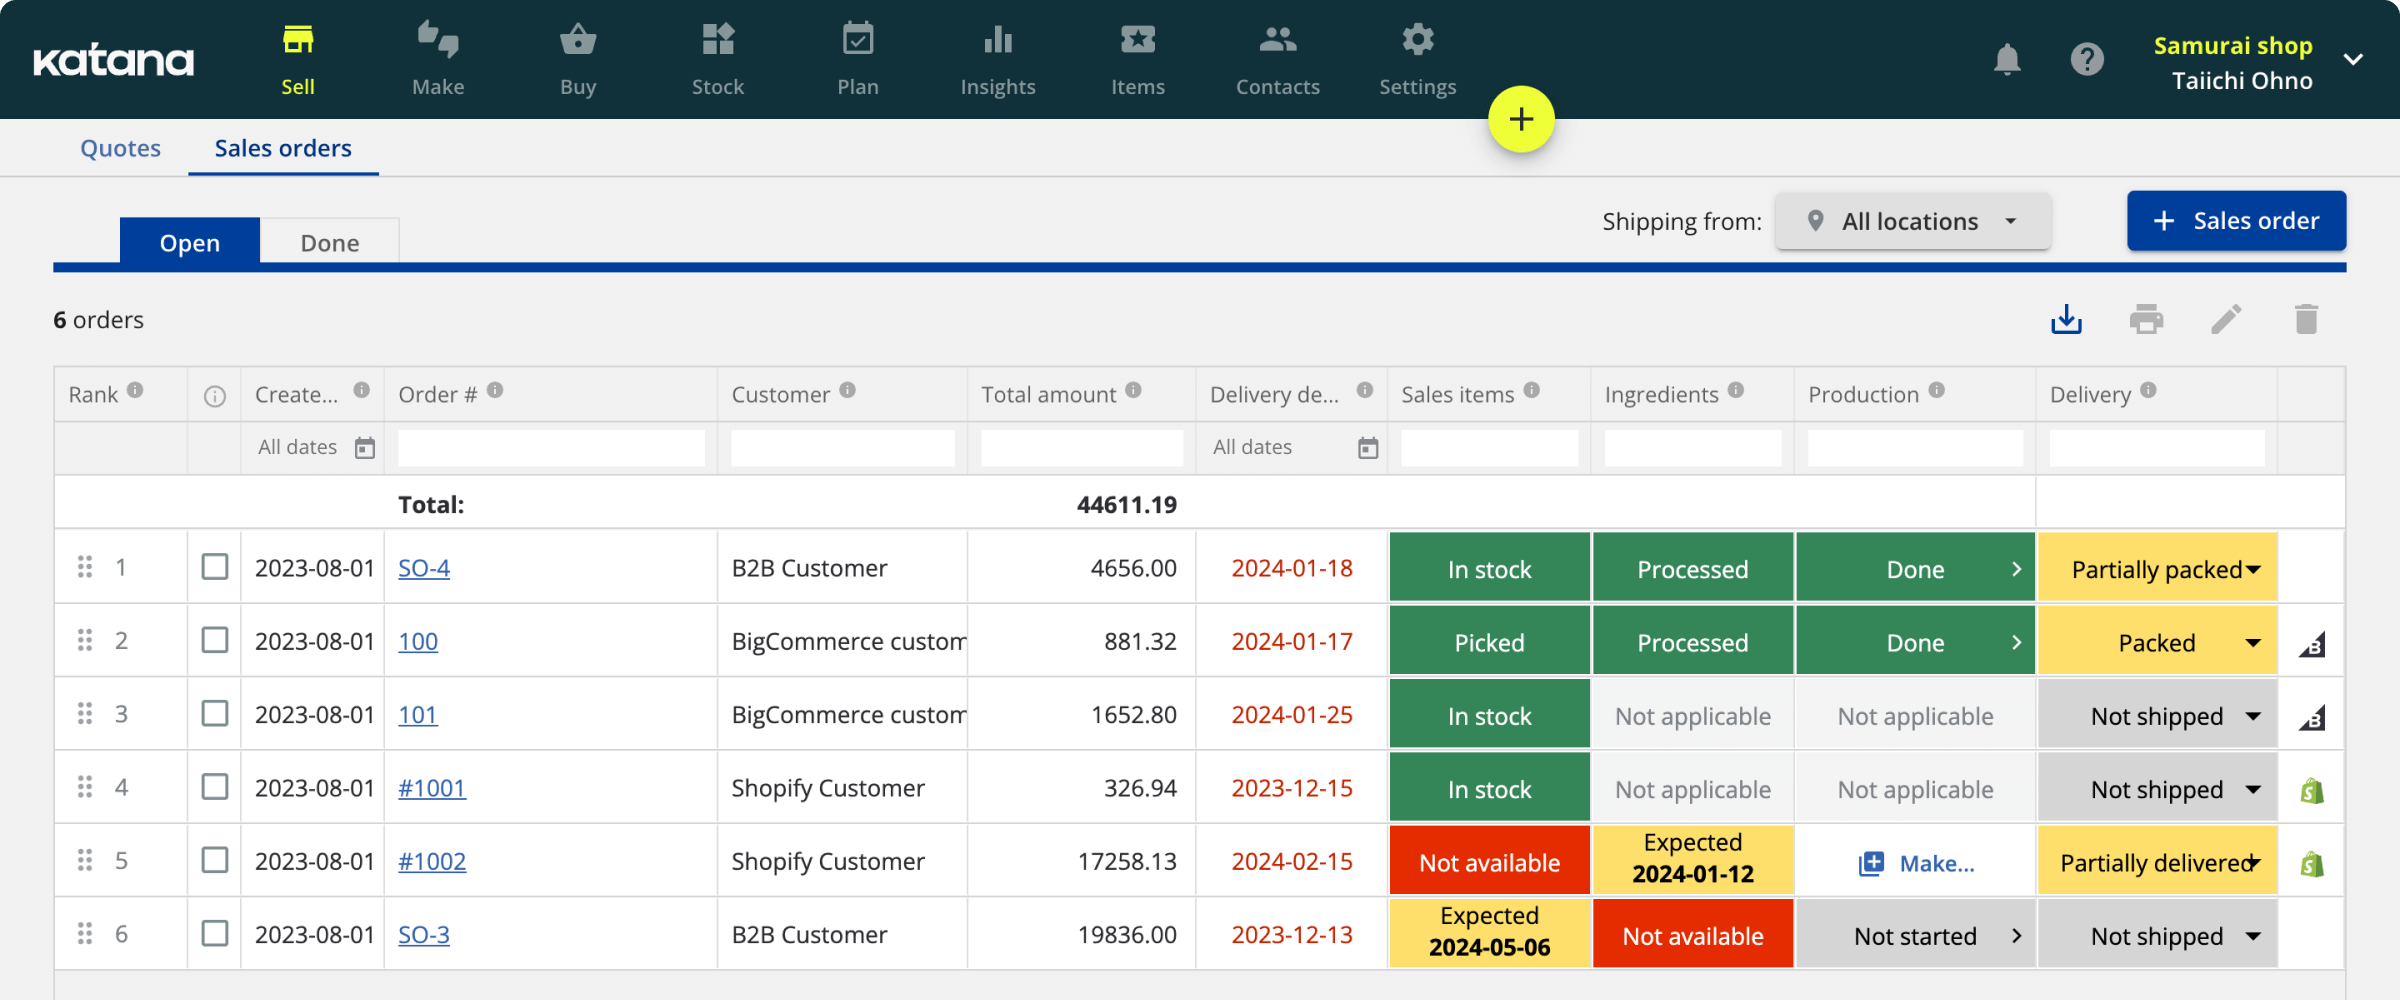
Katana’s cloud inventory platform lets you set reorder points for each item in your inventory straight from the Stock screen. Once the item falls to the specified level, Katana will notify you so you can order more raw materials or manufacture more products to ensure you won’t run out at a crucial moment.
Safety stock formula
The safety stock formula is used to calculate the amount of extra inventory that should be kept on hand. It takes into account the variability in demand and the lead time:
Safety stock = (Maximum daily demand x maximum lead time) – (minimum daily demand x minimum lead time)
For example, let’s say a business has a minimum daily demand of 8 units, a maximum daily demand of 12 units, a minimum lead time of 4 days, and a maximum lead time of 9 days. Their safety stock would be:
Safety stock = 12 x 9 – 8 x 4
Safety stock = 76
This means that the business should keep 76 units of safety stock on hand to meet unexpected spikes in demand.
A comprehensive inventory forecasting strategy will take into account both the reorder point and the safety stock. By using these formulas, businesses can ensure they have enough inventory to meet customer demand while also avoiding excessive stockpiling.
AI inventory forecasting
We’ve gone over all kinds of inventory forecasting methods and formulas, but there is another method that barely requires any hard work from you — AI inventory forecasting.
AI inventory forecasting takes historical data, does some magic, and gives out an inventory forecast. Unlike traditional forecasting methods, which often rely on linear regression models or time-series analysis, AI techniques can handle complex patterns, multiple variables, and non-linear relationships in the data.
How it works
AI models, once trained on historical sales, inventory data, and external factors such as economic indicators, seasonal trends, and even weather forecasts, can predict future demand more accurately than traditional methods. The best part about AI models is that they can improve themselves. They can learn from past patterns and continuously improve as they gather more data. This can make them incredibly effective at forecasting demand, even for products that don’t follow basic consumption patterns.
Now, AI has been used for forecasting for years, mostly for weather forecasting. But I’m sure we’ve all experienced the occasional inaccuracy of these forecasts. I’ve opened my weather app while standing in the pouring rain just to see the current weather as 0% rain and a mild breeze. So, it’s worth keeping in mind that these things are not infallible.
Advantages of AI inventory forecasting
- Precision — AI models can digest vast amounts of data and identify patterns invisible to the human eye, leading to highly accurate inventory forecasts.
- Adaptability — They can quickly adapt to changes in the market, adjusting forecasts in real time as new data becomes available.
- Efficiency — Automating the forecasting process with AI reduces the time and labor traditionally required for inventory planning.
- Insightful — AI can also provide insights into customer behavior, product trends, and potential supply chain disruptions, allowing businesses to strategize proactively.
Implementation challenges
Despite its benefits, implementing AI in inventory forecasting is not without challenges. It requires a significant upfront investment in technology and skilled personnel. Moreover, the success of AI models depends on the quality and quantity of the data available, making it crucial for businesses to maintain accurate and comprehensive datasets.
If most of your data is presented in cursive on a post-it note, you won’t be benefiting from AI forecasting any time soon. This will also apply if you’re just starting out and don’t have vast amounts of data yet. However, for companies that have been in the game for many years, and have amassed loads of data, AI can be an invaluable tool for inventory forecasting.
4 inventory forecasting best practices
There are some things you need to take into account to ensure your forecasts are accurate. Here are some of the best practices when it comes to inventory forecasting.
1. Use data
As mentioned before, data is key to making accurate forecasts. Make sure to use data from as many sources as possible, including sales, production, supplier, and shipping data. If you’re not sure where to start, try using your enterprise inventory management software or some other system that can help you collect and analyze all of your data in one place.
2. Be flexible
The market is always changing, so it’s important to be flexible in your forecasting. If you see that your sales are trending downward, don’t be afraid to adjust your forecast accordingly. There really is no point in stacking up on 3D TVs just because of your 2010 forecast, even though you’ve only sold one within the last 5 years.
It’s also important to be flexible in your inventory management. If you find that you’re not selling as much of a certain product as you thought, don’t be afraid to adjust your inventory levels.
3. Test and refine
The best way to hone your forecasting skills is to test and refine your methods constantly. After you’ve created a forecast, compare it against actual sales data. If there are discrepancies, take a closer look at your methods and see where you can make adjustments.
Over time, you’ll develop a more accurate forecast by constantly testing and bettering your methods. By constantly tweaking your process, you’ll be able to create more accurate predictions that can help guide your business decisions.
4. Communicate with stakeholders
Inventory forecasting can be complex, so it’s important to communicate your plans and methods to all relevant stakeholders. This includes managers, sales staff, production staff, and suppliers.
By keeping everyone in the loop, you can avoid misunderstandings and ensure that everyone is working towards the same goal.
4 mistakes in inventory forecasting
Now that we’ve gone over some of the best practices in inventory forecasting, let’s look at the most common mistakes.
1. Not accounting for seasonality
If your business experiences peaks and valleys in demand throughout the year, consider this in your forecast. Seasonal adjustments can be made by looking at historical sales data and identifying patterns. Don’t just average out your demand and keep ordering the same amount of winter parkas for every quarter.
2. Failing to account for changes in the market
The market is always changing, and your forecasting should reflect that. Whether it’s a change in customer needs or a new competitor, ensure you consider all relevant factors when making your forecast.
3. Relying on gut instinct
Gut instinct can be helpful, but it’s not always accurate. When making forecasts, be sure to use data-driven methods such as trend analysis to ensure you’re getting the most accurate picture possible.
4. Not being realistic
It’s important to be realistic when making forecasts. If your forecast is too optimistic, you may end up with excess inventory. On the other hand, if it’s too pessimistic, you could run into stockouts. Find a happy medium by using data to inform your forecast.
Inventory forecasting made easy with Katana
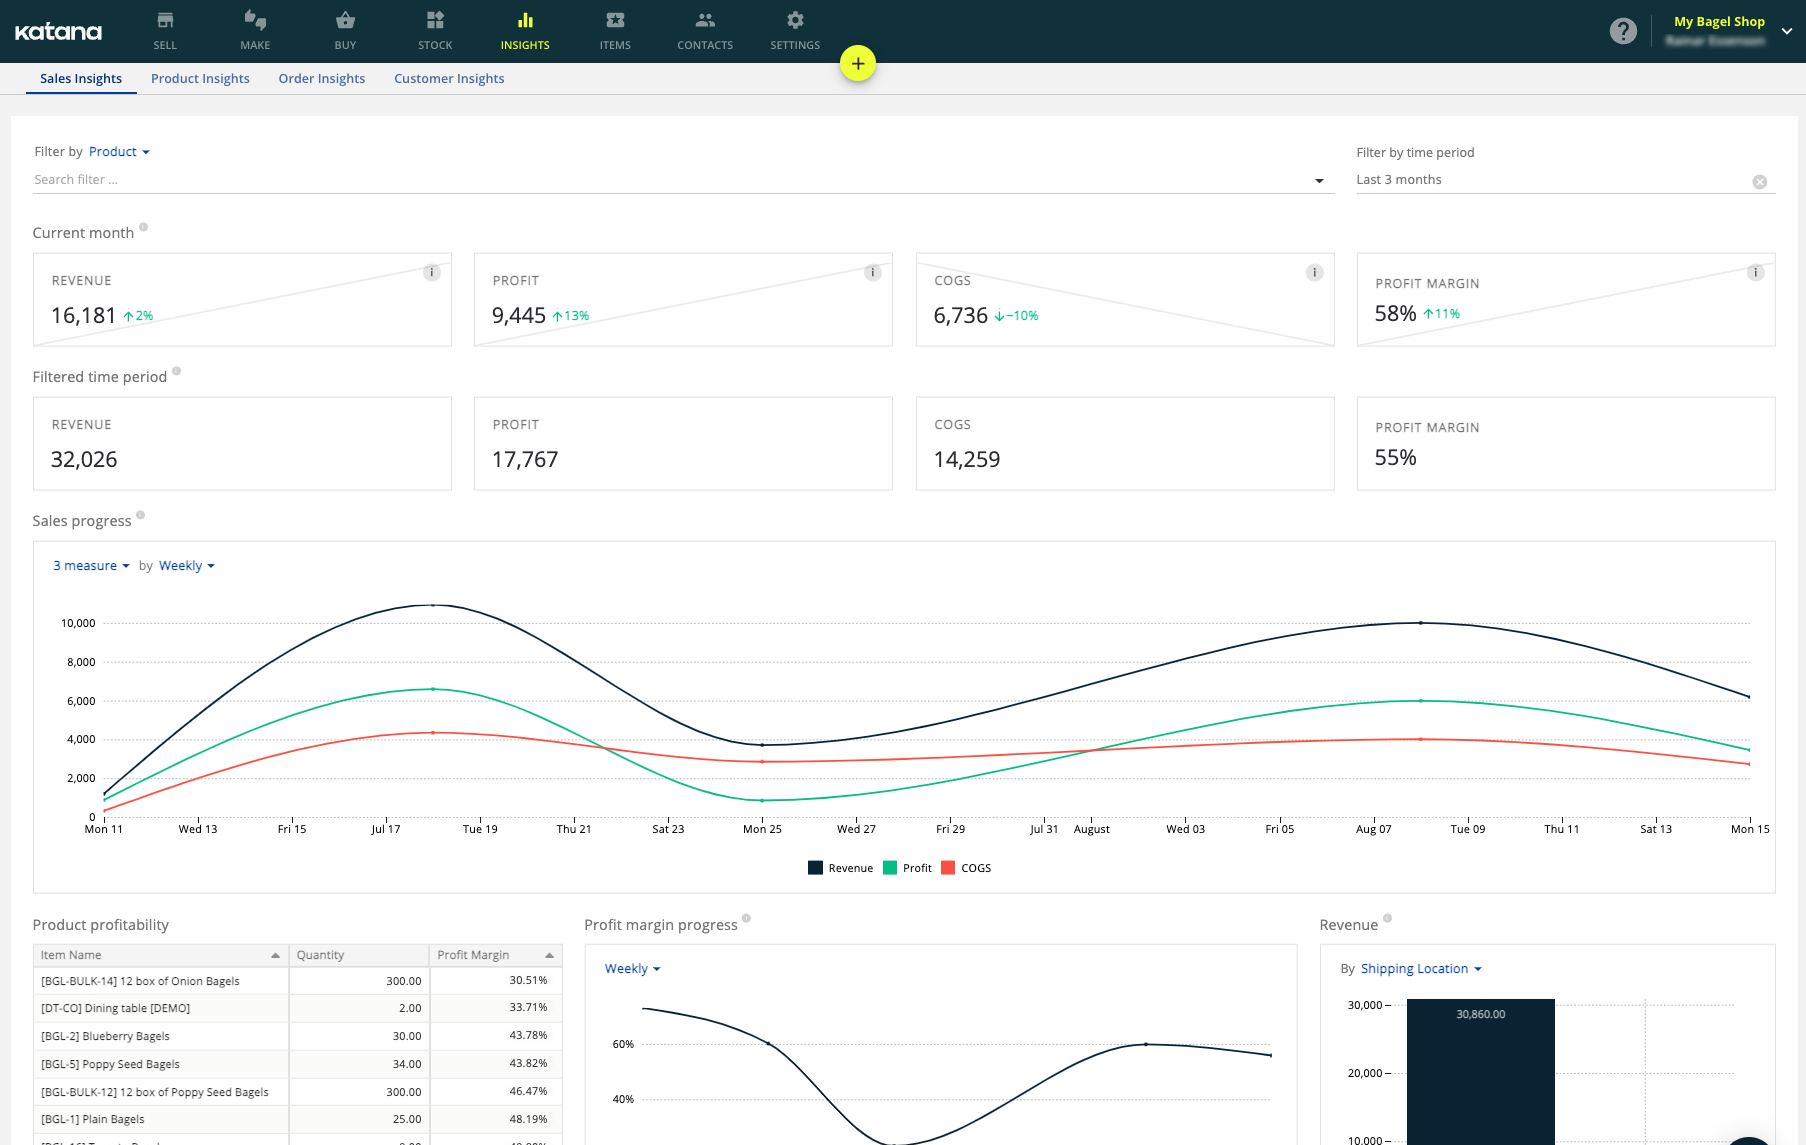
Katana’s inventory management software does the hard work for you. It gives you access to all the relevant data directly from the platform. Katana allows you to select a period, and it will show you a line graph with revenue, profit, and COGS nicely displayed. You can also filter the data by:
- Product
- Category
- Customer
- Location
This gives you a clear visual overview of your sales performance over the selected period, making it easy to see how the demand changes over time.
Katana’s multilocation support is particularly useful, as it allows you to see how demand varies from one location to another. For example, you might find that demand is increasing in one location but decreasing in another. This information can be used to make decisions about where to focus your efforts.
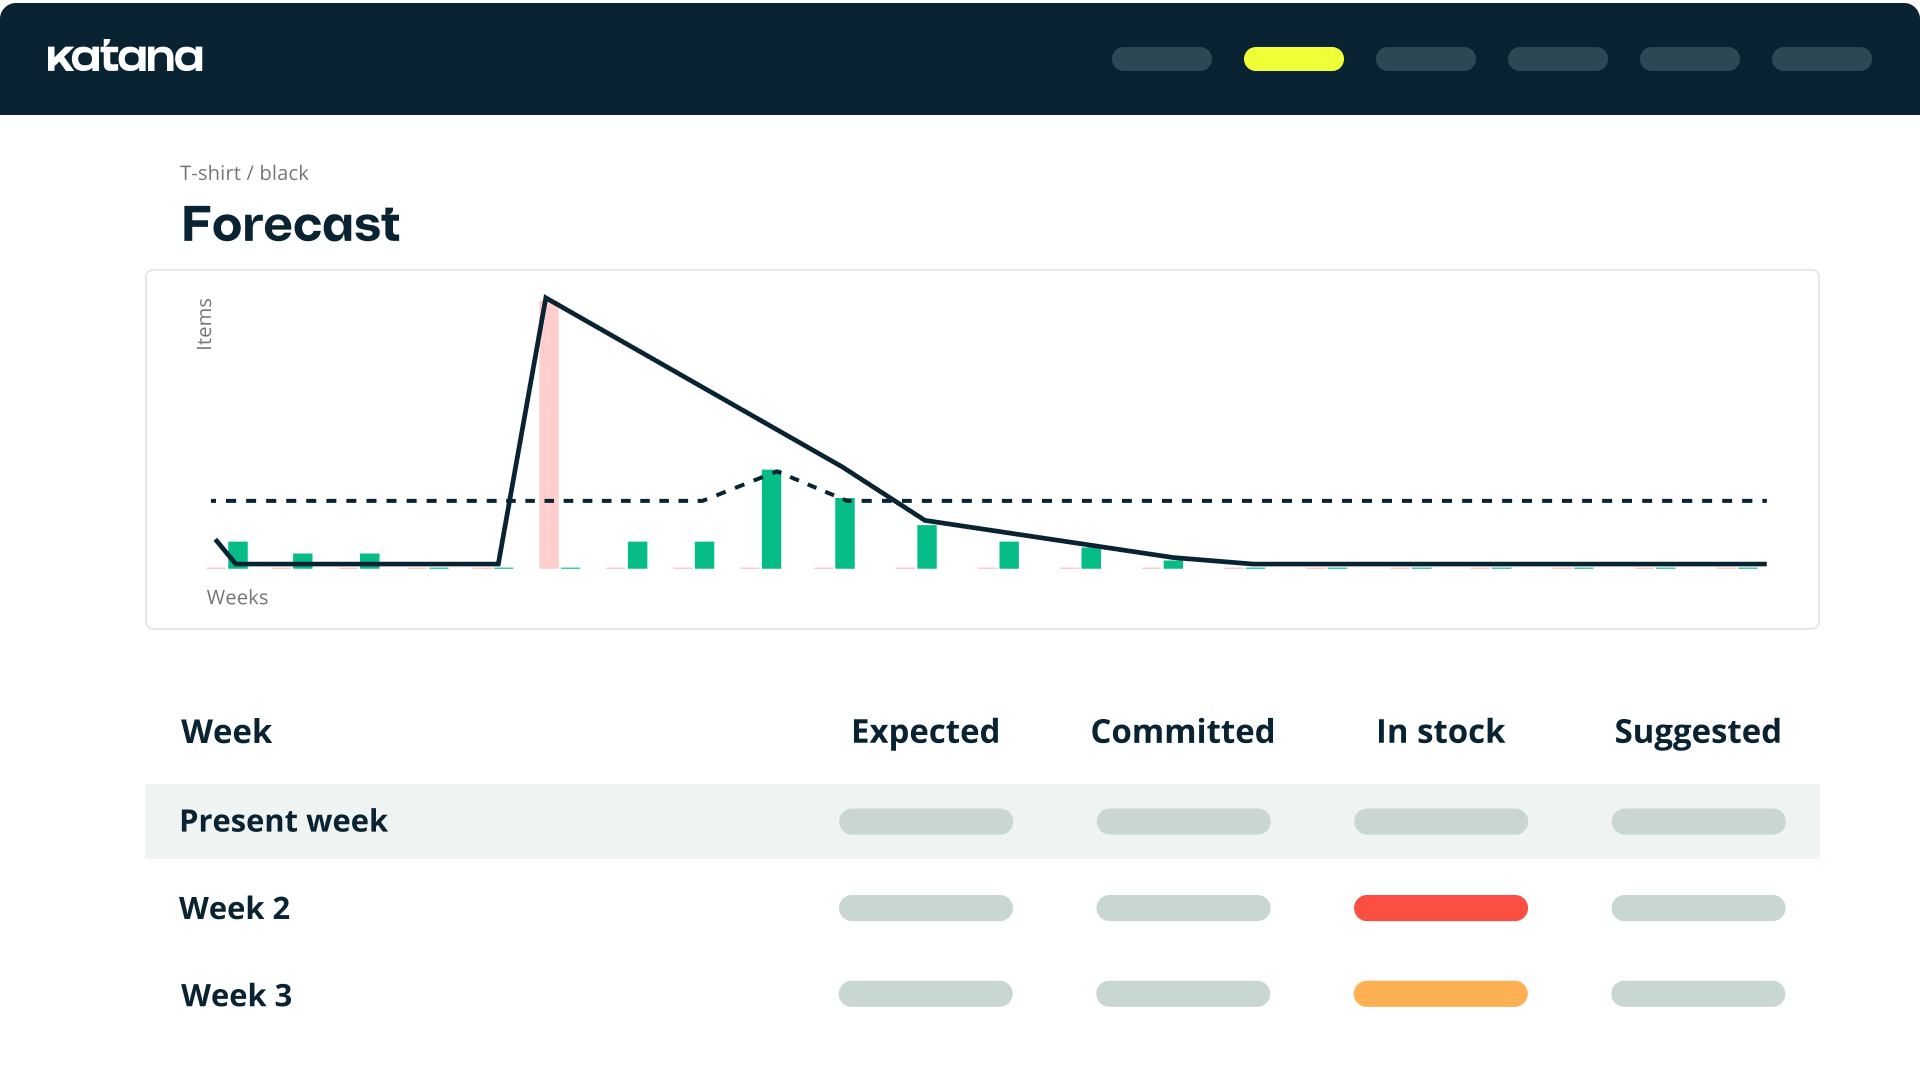
What’s more, Katana eliminates the need for complicated formulas and mathematical methods, so you can focus on growing your business. With Katana’s planning and forecasting, you get:
- SKU-based lead times
- Minimum order quantity
- Automatic reorder points
- Safety stock calculations
In addition, Katana keeps track of all the relevant data about your purchases, sales, and production. The insights feature allows you to track your sales performance, monitor your revenue, profits, and costs, and spot sales trends.
It supports multiple locations, so you can have a granular overview of every inventory location. This allows you to make changes in your storage processes based on the demand in certain locations.
Besides the robust inventory management features, Katana seamlessly integrates with accounting, CRM, e-commerce, and other tools to provide a complete picture of your company’s operations. This helps keep all your business tools synchronized and up-to-date without manually copying and pasting everything.
You can check out the planning and forecasting feature with the interactive demo below. And if you want to get all your questions answered regarding Katana and how it can help you plan your inventory, book a demo today.
Inventory forecasting FAQs
How to forecast inventory?
Forecasting inventory looks into historical sales data and market trends and analyzes other relevant factors like seasonality, economic conditions, and promotional activities to predict future inventory needs. The goal is to have the right amount of stock to meet customer demand without overstocking or understocking.
To effectively forecast inventory, you typically need a systematic approach that may involve several steps:
- Collect and analyze data — Gather historical sales data, inventory levels, lead times, and any other relevant information.
- Choose a forecasting method — Decide between qualitative and quantitative methods based on your business needs and the data’s complexity.
- Implement technology solutions — Utilize inventory software that can handle data analysis, apply forecasting models, and provide actionable insights.
- Review and adjust — Regularly review forecasted outcomes against actual sales to refine your forecasting process.
For businesses looking to streamline this process, a solution like retail inventory software that features robust forecasting tools, data analytics, and inventory management capabilities can be invaluable. Katana, for example, offers such features, enabling businesses to automate and optimize their inventory forecasting with ease.
What is inventory forecasting?
Inventory forecasting, also known as demand planning or demand forecasting, is the process of estimating the amount of inventory required to meet future customer demand. By analyzing past sales data, market trends, and considering factors such as seasonal fluctuations and promotional impacts, businesses can predict future sales and adjust their inventory levels accordingly. The aim is to balance the need for having enough stock to satisfy customer orders while minimizing the costs associated with excess inventory.
Effective inventory forecasting helps in reducing stockouts and overstock situations, improving cash flow, and ensuring customer satisfaction by having the right products available at the right time.
What is required to forecast inventory?
To forecast inventory accurately, several key elements are necessary:
- Historical sales data — This is the cornerstone of inventory forecasting, providing insights into past trends and patterns.
- Market analysis — Understanding market trends and external factors that can affect demand, such as economic indicators or consumer behavior changes.
- Inventory management software — A robust system that can analyze data, apply forecasting models, and offer real-time insights is crucial. This software should also integrate with other business systems for seamless data flow.
- Adaptability — The ability to adjust forecasts based on new data or unexpected market changes is essential for maintaining accuracy.
- Expertise — Knowledge of different forecasting methods and the ability to interpret data correctly can significantly impact the effectiveness of your inventory forecasts.
For those seeking a comprehensive solution, inventory software with advanced forecasting capabilities, such as Katana, can provide the tools and flexibility needed to manage inventory efficiently, allowing businesses to focus on growth and customer satisfaction.
Readers also liked


Get visibility over your sales and stock
Wave goodbye to uncertainty by using Katana Cloud Inventory for total inventory control