How to calculate average inventory in manufacturing
Inventory management will be the backbone of your business — and the bane of your inventory manager’s existence.
Have too much inventory on hand, and your profit margin will decrease. Have too little, and you’ll find yourself quickly running out. When it comes to keeping inventory, it’s a never-ending balancing act.
Those practicing lean inventory obsess over finding the ideal inventory amount, and many achieve this by learning how to calculate average inventory.
Read on to learn how to calculate inventory turnover ratio for your business, including all the necessary formulas for calculating your beginning and ending inventory.
Average inventory calculation formulas
In case you just want to know what is average inventory cost formula without too much reading, here you’ll find everything for calculating inventory levels.
- Average Inventory = (beginning inventory + ending inventory) / 2
- COGS = Beginning inventory + purchases – ending inventory
- Beginning inventory = COGS – purchases + ending inventory
- Ending inventory = Beginning inventory + purchases – sales
Confused? Read on as we’ll explain these formulas, with average inventory examples later.
What is average inventory?

Average inventory estimates the amount or value of inventory a company has over a specific time.
This figure is important for businesses because it helps them budget and plan for future inventory needs. Additionally, average inventory can be used to assess a company’s overall financial health. There are a few different ways to calculate average inventory.
The most common method is to take the total inventory value at the beginning of a period, add it to the total value at the end, and divide it by two.
Another way to calculate the average inventory is to take the total cost of goods sold (COGS) during a period and divide it by the number of days in that period.
Regardless of the method used, average inventory provides valuable information you can use for business-critical decisions.
For example, if a company’s average inventory increases over time, it may need to invest in more storage space or hire additional staff to manage inventory. On the other hand, if a company’s average inventory level is decreasing, it may be able to cut costs by reducing its items on hand.
Overall, average inventory is a helpful tool for businesses of all sizes.
By understanding and tracking their average inventory, companies can make informed decisions about their inventories and ensure they meet their customers’ needs.
Get the ultimate guide to inventory management
A comprehensive ebook that covers everything you need to know about inventory management.
How to calculate average inventory in practice?
There are a few ways you can use the results of your average inventory calculations.
For example, you can use them to help determine how much inventory you need to keep on hand or to help you budget for future purchase orders for raw materials and components.
Average inventory calculations can also be helpful when it comes to forecasting future overall sales volume. Knowing how to determine how much inventory you typically have on hand can better estimate how much product you’ll need to sell to meet your sales goals.
Finally, average inventory calculations can also be used to monitor your inventory levels over time.
When you calculate average inventory levels, you can spot trends that indicate a need for adjustments in your purchasing or production plans. So, as you can see, there are various ways you can use average inventory calculations to benefit your business.
Why is it important to know average inventory?

One reason is that your inventory will fluctuate. One month you might get a massive delivery due to increasing orders. Or maybe you sell seasonal goods, like ice cream in the summer or holiday decorations in winter.
For situations like these, looking at one point in time isn’t going to give you an accurate picture of your inventory.
Another reason to look at your average inventory is that it helps you spot purchasing and manufacturing trends for future sales. For example, if your average inventory is slowly increasing over time, that could be a sign that you need to adjust your ordering process. On the other hand, your average inventory decreasing could be a sign that you’re not ordering enough to meet customer demand, and you’ll start losing overall sales volume.
Looking at your average inventory can also help you decide on resource capacity planning, like storage space and staffing. You can plan accordingly if you know that you typically have a certain amount of inventory on hand. For example, if you need to store more inventory during the holiday season, you can rent a larger storage unit or hire additional staff to help manage everything.
In short, looking at your average inventory can give you a more accurate picture of your business’ needs than looking at your current inventory alone.
The limitations of average inventory
A few challenges come with using the average inventory cost formula to value inventory.
First, the formula assumes that all the inventory on hand is sold evenly throughout the year. This isn’t always the case, as some items may sell more quickly than others. This can lead to an inaccurate inventory valuation if not accounted for properly.
Another challenge is that the formula for average inventory only considers the cost of goods sold. It doesn’t consider other important factors, such as:
- Storage costs
- Manufacturing overhead
- Insurance
- Shrinkage
This can lead to an underestimation of the true cost of inventory.
Finally, the formula for average inventory doesn’t account for price changes over time. If prices go up or down, this will impact inventory valuation. This is why it’s important to keep track of prices and adjust the formula accordingly.
Despite these limitations, an average inventory formula is still a helpful tool for valuing inventory.
What is the inventory turnover ratio?
The inventory turnover ratio (ITR) is a way of measuring how quickly inventory is moving through a business.
To calculate ITR, you need to divide COGS by the average inventory.
A high ratio means that inventory moves quickly and efficiently through the business. This is generally seen as a good thing, as it indicates that the business is selling its products or services promptly and not tying up too much capital in stock.
On the other hand, a low ratio could indicate that the business is struggling to sell its products or that it’s holding onto too much stock.
This can tie up working capital and lead to cash flow problems.
Generally speaking, an ITR of 2-3 is considered healthy. But the ideal ratio will depend on the industry and the type of business. For example, companies selling perishable goods will need to turn over inventory much more quickly than those selling items with a long shelf life.
The inventory turnover ratio is just one tool you can use to measure the health of your business.
However, before making any business decision, be sure to look into other factors, such as profitability and cash flow.
Average inventory formula, calculations, and examples

Now that we’ve gone over the importance and limitations let’s see how to find average inventory. To calculate average inventory, use the following formula:
Average inventory = (Beginning inventory + ending inventory) / 2
For average inventory example, if your company’s beginning inventory for January is $10,000 and the ending inventory for January is $15,000, the average inventory for January would be $12,500.
You can extend this formula to cover longer periods, like adding up the inventory at the end of each month in a year and dividing it by 12. You can look at smaller timeframes, like examining a single month by taking an inventory at the month’s beginning and the month’s end and dividing it by 2.
Looking at average inventory is a good way to get a general idea of how much inventory a company has.
It can help you forecast future inventory needs and decide safety stock levels. When calculating average inventory, be sure to use consistent methods and timeframes to compare results. Otherwise, you may not get an accurate picture of your company’s inventory levels.
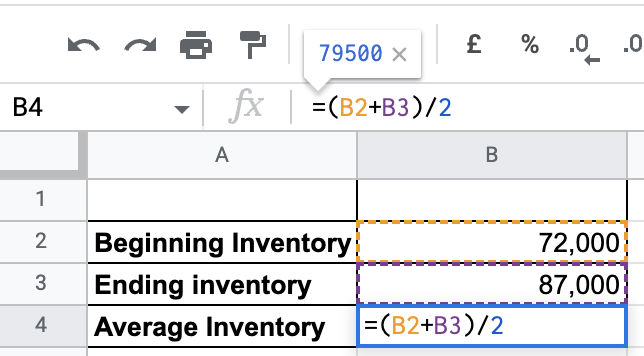
Average inventory formula in Excel
Let’s quickly take a look at how to add the average inventory calculation formula to your Excel spreadsheet. For this example, let’s say your beginning inventory was $72,000, and your ending inventory was $87,000.
To find the average, you’ll need to enter the following formula in the average inventory cell:
= (Beginning inventory + ending inventory) / 2
And in your spreadsheet application, it would look like this, giving you an answer of $79,500.
How to calculate the beginning inventory?
If you’re starting a new business, you won’t have any previous accounting periods to use for reference. In this case, you need to know how to calculate average inventory without beginning inventory or how to find the beginning inventory from scratch. Here’s how:
- Determine the cost of each item in your inventory
- Add up the total cost of all items in your inventory
- Divide the total cost by the number of items in your inventory
This will give you your average cost per item.
You can then use this number to calculate the value of your beginning inventory. It’s important to keep track of your beginning inventory as this will give you a better idea of your overall inventory costs and help you make more informed decisions about your stock.
If you don’t have the previous accounting period’s ending inventory, you’ll need to calculate the beginning inventory. You’ll need to know the cost of goods sold and the ending inventory for the current accounting period.
To calculate COGS, use the following formula:
COGS = Beginning inventory + purchases – ending inventory
Once you have the cost of goods sold, plug it into this formula to calculate the beginning inventory:
Beginning inventory = COGS – purchases + ending inventory
For example, let’s say that your company’s cost of goods sold for the current accounting period is $10,000. You also made $5,000 in purchases, and your ending inventory is $2,000. This means that your beginning inventory must have been $3,000.
How to calculate ending inventory?

For calculating ending inventory, you need to know the period’s beginning inventory, purchases, and sales. The formula is:
Ending inventory = Beginning inventory + purchases – sales
For example, if your business started with $10,000 in inventory, made $5,000 in purchases during the period, and had $6,000 in sales, you can calculate the ending inventory like this:
Ending inventory = $10,000 + $5,000 – $6,000
Therefore, the ending inventory value for this example would be $9,000.
Don’t fancy yourself as a mathematician? Here’s an alternative many companies use to navigate when performing manual stocktakes and equations:
How to calculate average days to sell inventory?
Average days of inventory before selling (also called days inventory outstanding or DIO) measures the number of days to sell inventory. This metric is important because it gives insights into a company’s operating efficiency and effectiveness in managing its inventory levels.
Calculating the average inventory days to sell products is simple and only requires a few pieces of information:
- The value of ending inventory
- The value of beginning inventory
- The cost of goods sold (COGS)
And it’s calculated like this:
(Ending inventory / COGS) * number of days in reporting period
Cloud inventory software for calculating average inventory
Many manufacturers implement a perpetual inventory valuation method for real-time inventory records.
This valuation method is achievable with computerized point-of-sale (POS) systems and live inventory management software that can help you monitor inventory movements in real time to reflect inventory changes immediately.
Instead of messing around with your average inventory formula in Excel, let your cloud solution do it for you automatically,
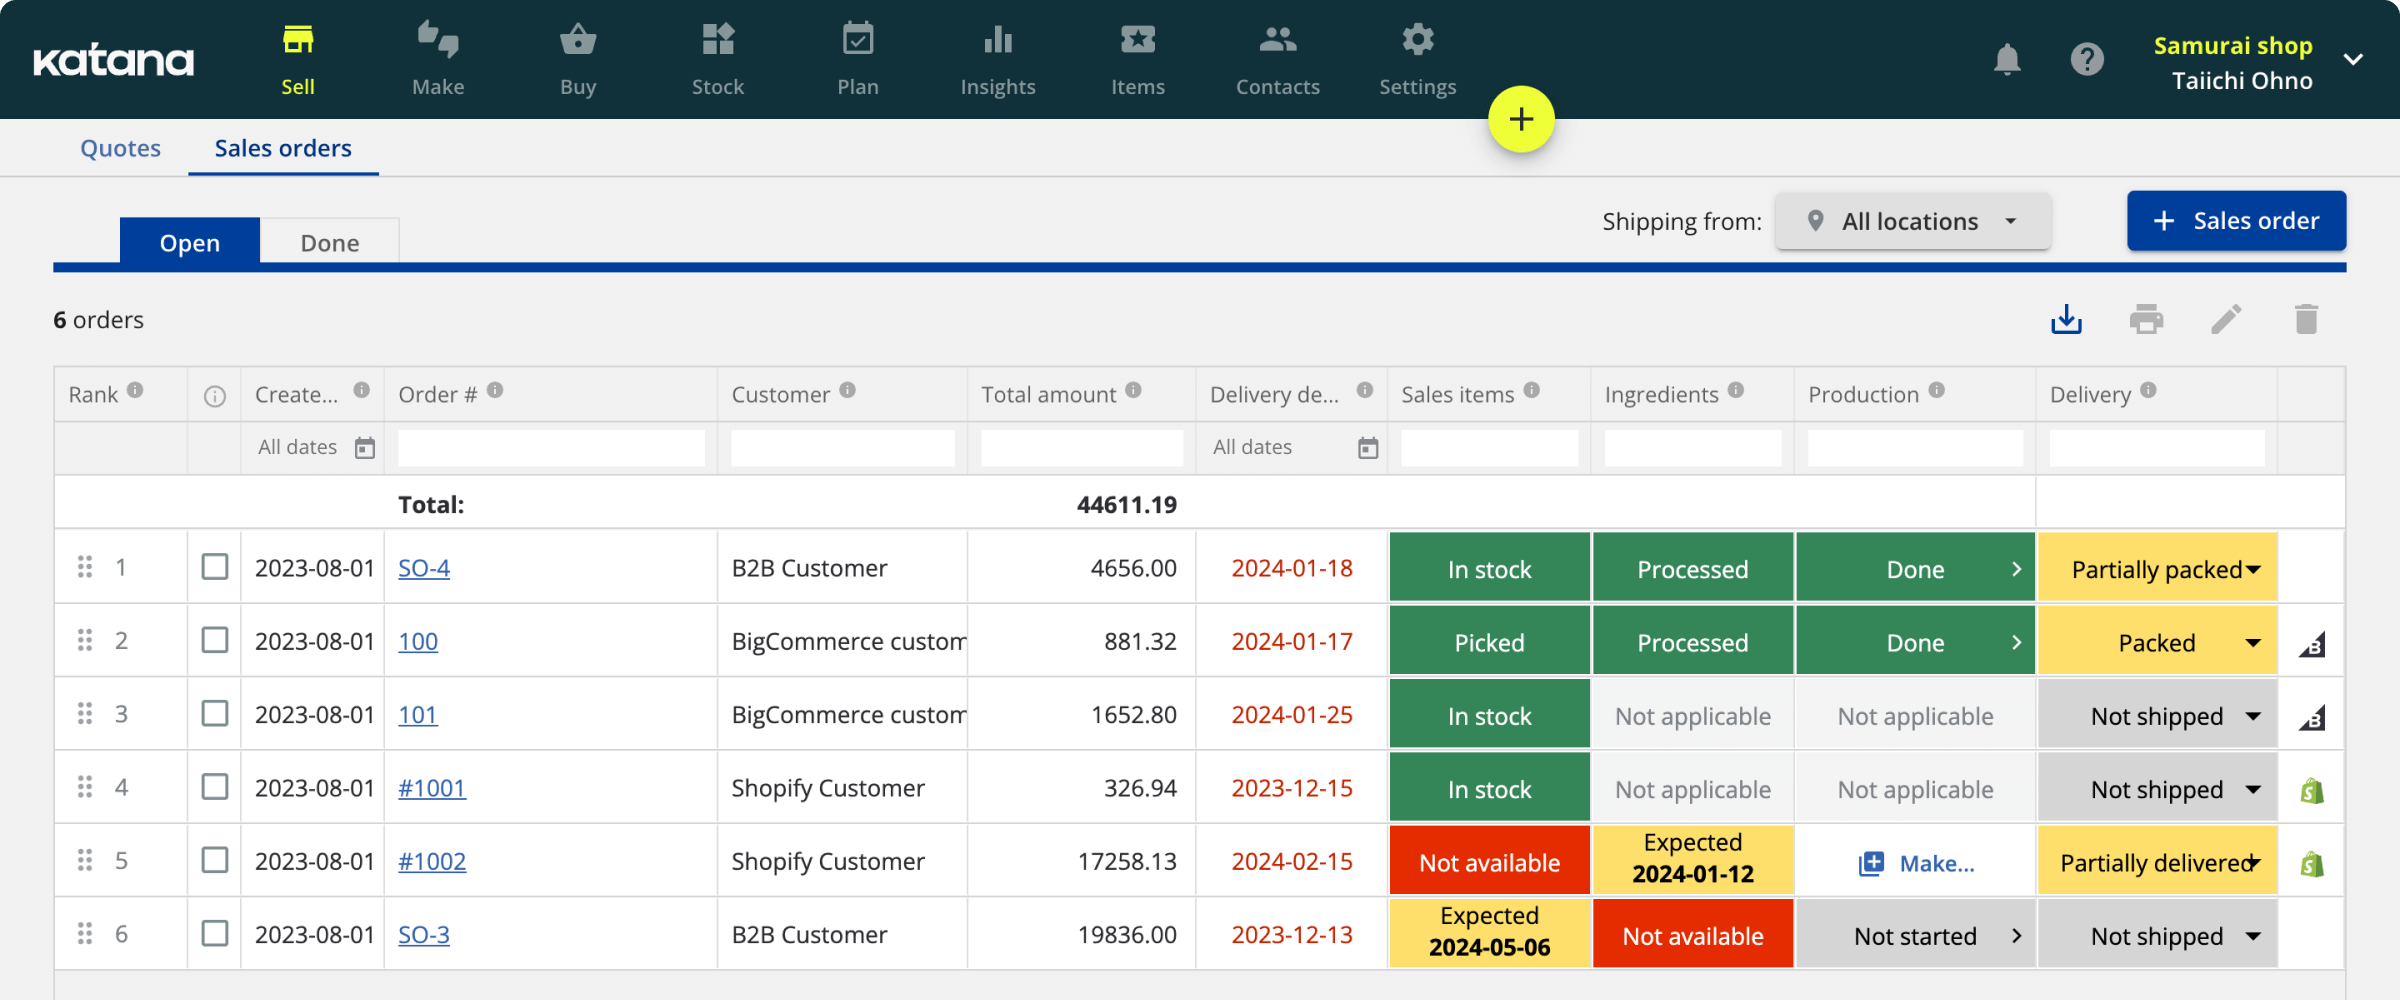
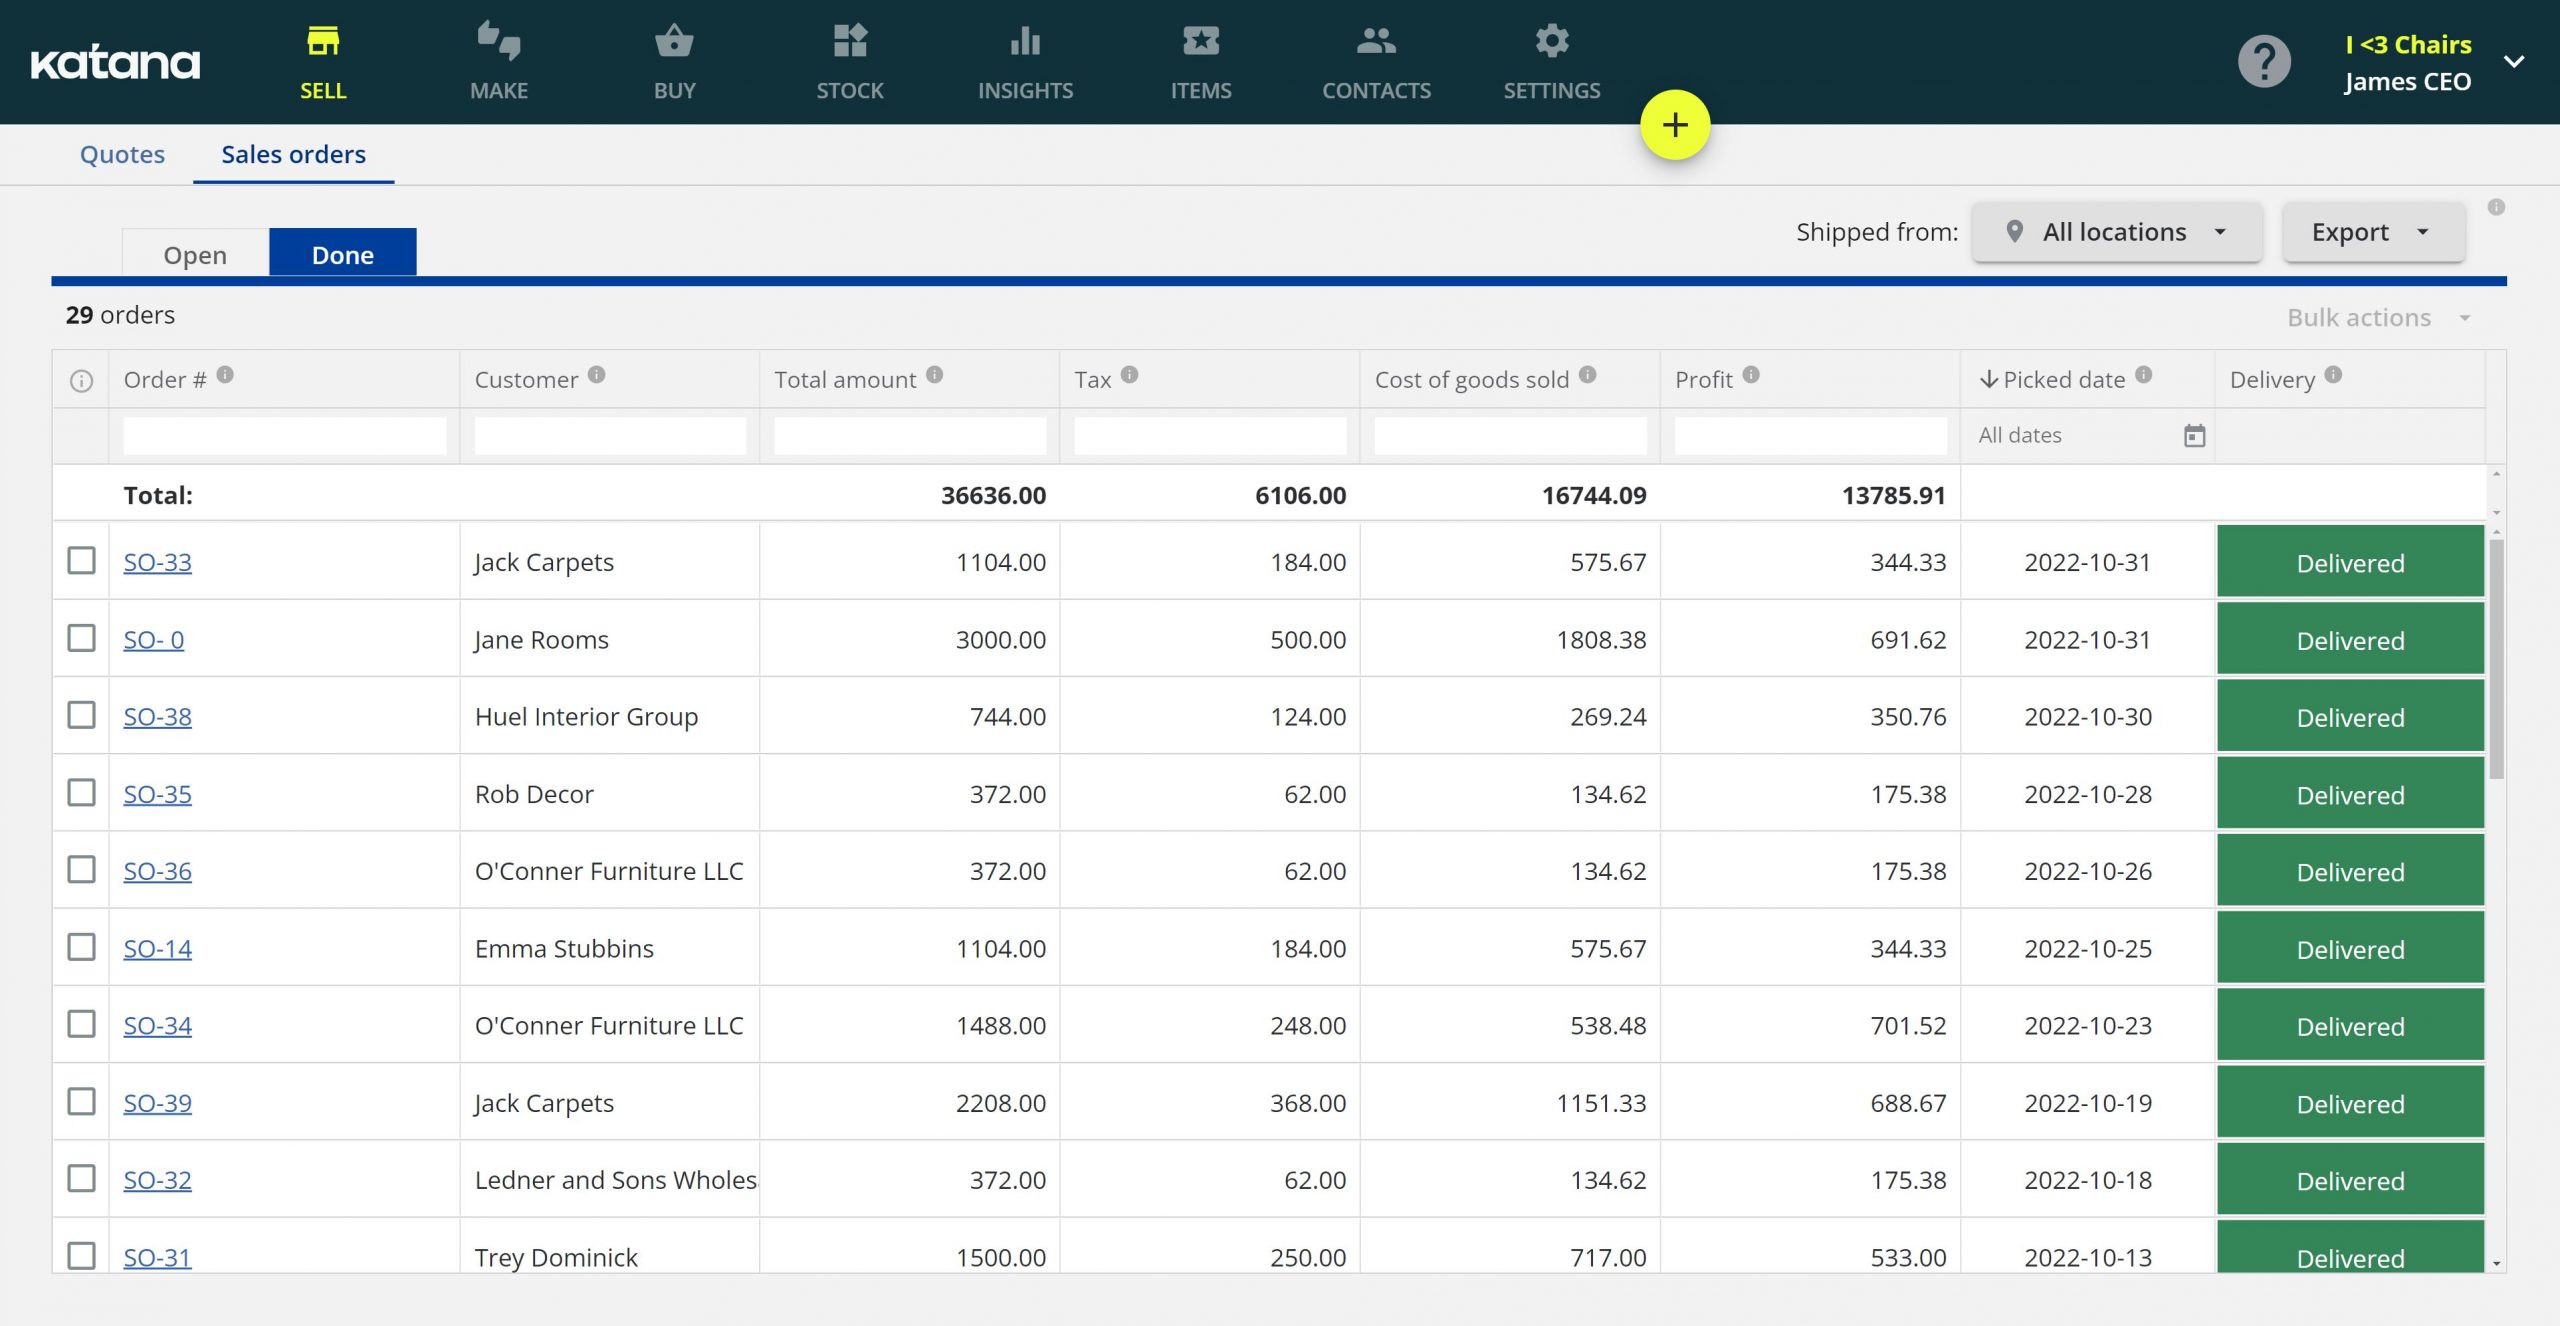
Katana’s cloud inventory platform is a perpetual inventory management software that uses moving average cost (MAC) to provide you with real-time inventory valuations.
Each time you create a purchase order, the average cost for the items in stock is recalculated. Katana adds the cost of newly acquired items to the cost of items already in stock and divides that by the number of items in stock.
Why is this important?
Well, your raw materials never stay at the same price — inflation, bulk discount deals, or a shady supplier — many factors will affect the cost of the items you buy. Katana has an automatic average inventory calculator that uses MAC and recalculates your inventory value for every purchase to get the most accurate valuation.
So, what is Katana? It’s an all-in-one platform that helps manufacturers with:
- Live inventory management across multiple locations
- Managing manufacturing processes
- D2C and B2B e-commerce sales management
- Managing a real-time master production schedule
- Unifying their existing business tools through seamless integrations (for example, QuickBooks Online, Xero, Shopify, BigCommerce)
- And much more
Check it out for yourself by requesting a demo.
More on inventory management


Get visibility over your sales and stock
Wave goodbye to uncertainty by using Katana Cloud Inventory for total inventory control