ABC inventory: Get the most out of your best-selling products
Over a hundred years ago a man with a brilliantly complicated name stumbled upon a brilliantly simple principle.
Italian engineer Vilfredo Federico Damaso Pareto came to realize there was a pattern so common in the universe that it has been applied across a range of disciplines since.
In inventory management, it evolved and became the inventory ABC.
What is ABC inventory?

ABC inventory is an approach to managing inventory that attempts to prioritize sets of stock by the amount of value they bring to the business.
Basically, it assumes that some stock is more valuable than others — which means that you should spend more resources on tracking “strong” stock and reducing the amount of “weak” stock.
So, provided you have a business with varying product values, this method can help reduce your carrying costs.
It’s a perfectly logical system that relies on the pattern which Mr. Pareto came up with, and the great thing is that you can do your own inventory ABC analysis with just a pen and paper. We’ll get around to that a bit later, but first, let’s go over some basics.
Get the ultimate guide to inventory management
A comprehensive ebook that covers everything you need to know about inventory management.
What is ABC analysis of inventory?
The ABC analysis of inventory is a method of categorizing inventory items based on their importance. The ABC analysis divides inventory into three categories, with “A” items being the most important and “C” items being the least important.
The ABC analysis can be used to help make decisions about which inventory items should be given priority in terms of stock levels and reordering. It can also be used to help make decisions about which inventory items are the most important to track and monitor.
The story says that Mr. Pareto was strolling through his beloved garden when he noticed his pea pod patch. Unfortunately, many of them were unhealthy, and when he thought about it, he realized that only 20% of them produced 80% of the healthy pods.
Drawing on this observation on distribution, he discovered that in Italy, during that time, 80% of the land was owned by 20% of the population. Which, of course, meant that most of the land was owned by the few.
100 years on, and that same principle seemed to apply to the world’s GDP. In 1979 it was found that 80% of the wealth in the world was owned by 20% of the people. Of course, this is not a natural law of the universe, but the funny thing is that this principle has been found to apply to a whole bunch of fields.
Here are some of the commonly noted areas:
- 20% of computer bugs cause 80% of crashes
- 20% of customers make 80% of profits
- 20% of staff produce 80% of the results
- 20% of patients create 80% of healthcare expenditure
The point here is to show that many things in life are not distributed evenly, and understanding that some things are more valuable than others means you can focus your energy in the right places.
If you fix the 20% of bugs that cause the most issues first, then you can make a quick effective impact. If you focus on the 20% of patients, then you can come up with solutions that save money in the future.
And the same things apply to inventory. Except, in this case, it’s called ABC inventory control.
What’s awesome is that the same magic applies to inventory management as it does to all those other examples. Honestly, it’s one of the things that, once you accept and understand, can change your entire mindset in business decision-making. Because once you appreciate which bits of your inventory are the most important, you can focus your energy there to get the most out of it.
In the same way, you see which inventory is just hanging around and gathering dust, you can do what you should have done a long time ago and stop overloading your inventory with dead weight. You can cut down on your carrying and storage costs. You can make sure that your inventory stock ratio is kept at an effectively high level.
Provided you are careful with your categorizations, the difference ABC can make in optimizing your inventory is not to be underestimated.
Dividing into ABC inventory

Not all stock was created equal. ABC inventory should quickly help you realize that. Just be careful you don’t get too hung up on the numbers, take the results in context.
Despite often being known as the 80/20 rule, ABC analysis in inventory management is not so cut and dry. In fact, ABC analysis divides an organization’s on-hand inventory into three classes.
1. Item A
These are the items that generally generate the most amount of sales but also constitute the smallest set of stock. They are items that require frequent reorders due to always requiring good stock levels and should be prioritized to avoid stock-outs. They are given the highest security priority in warehouses and stockrooms.
2. Item B
These are items that generate a medium amount of sales and profits while constituting a slightly bigger set of stock than item As. Items here are checked occasionally to see if they should be moved for inclusion into sections A or C.
3. Item C
These are the items that you have a lot of, but they don’t sell very well. This means that the low demand leaves them hanging around in inventory for long stretches of time. It is best to set a low reorder point for these and allow them to sell out before remanufacturing them.
What should be monitored with these is whether they should have production continued depending on if they are being sold enough. Often, it’s best to just make these make-to-order products — that way, you only start making the product after an order has come in.
And that’s how the items are divided in the ABC method of inventory. You can see that each classification has its own place. Remember that keeping track of the divisions is important because products can change in demand. Don’t just leave them to it.
ABC inventory classification
Okay, so understanding the divisions conceptually is one thing. But how do we know which items go into which category?
Well, before going into it, we need to split our items into classifications that have sensible distributions. The following are what many manufacturers would consider but remember that they are a rule of thumb. You should also consider that it depends on your business model, as well the number of item types you stock.
But here are the lines to start with:
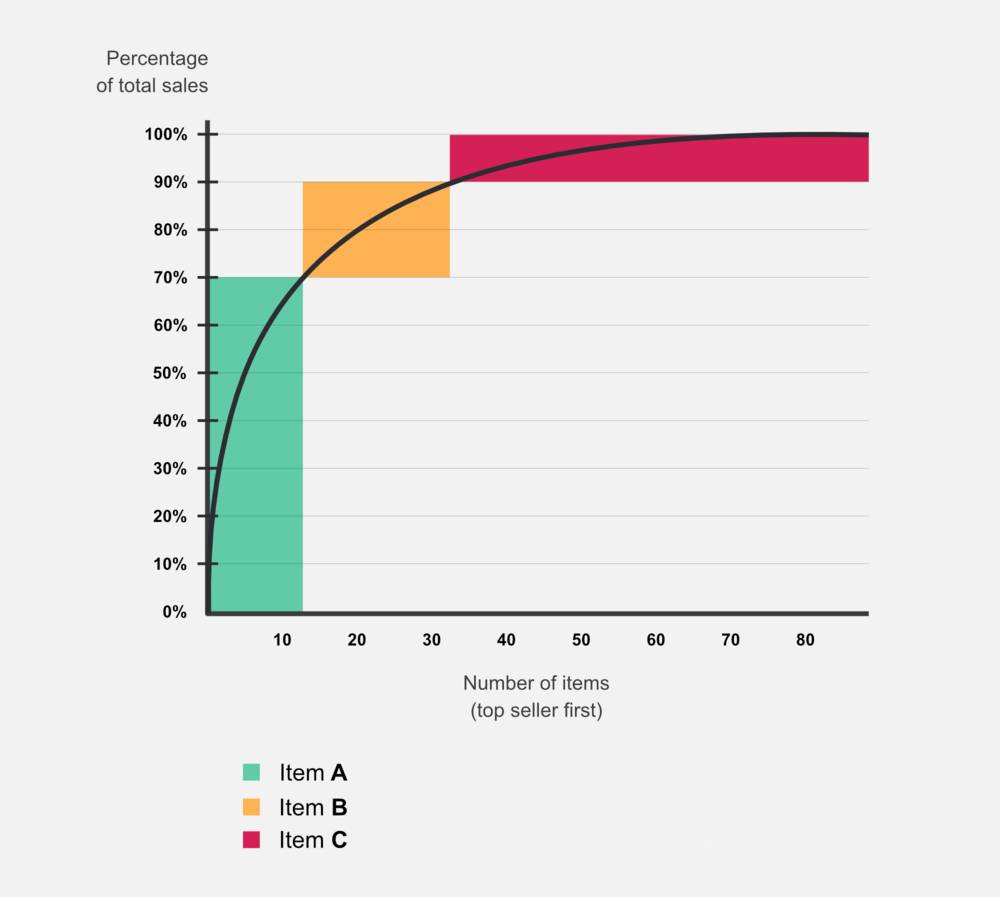
- Item A — The top 15% represent 70% of sales
- Item B — The middle 20% represents 20% of sales
- Item C — The bottom 65% represent 10% of sales
The graph below demonstrates the general classifications for ABC inventory analysis. Note that item A creates 70% of total sales whilst only constituting 15% of the items in inventory.
How to calculate ABC inventory?
Now for the deep dive.
Hold your nose and take a deep breath.
First, let’s look at an example inventory for a leather goods business and determine which items would be in which classification. To start, we got the columns beside each item which show the annual demand as well as the cost per unit. This is going to be the starting point for your calculations.
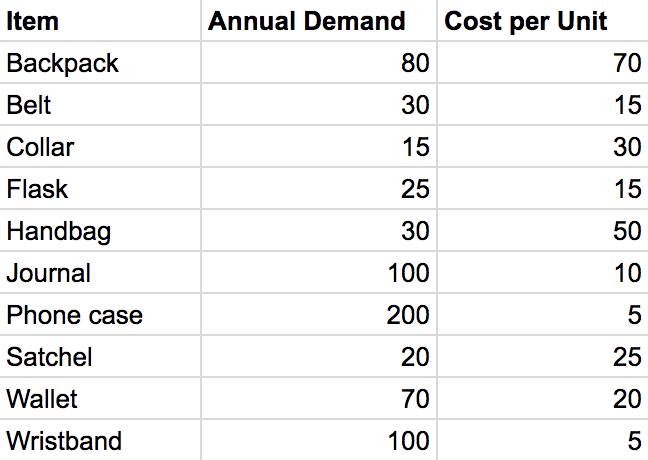
After that, you want to multiply the demand and cost to get the annual cost for each item. And then, you want to add up all of them so you can get a total cost for the whole inventory.
The table above shows you the value that each item brings and the total of all of them — $19,475.
Now, you can divide each annual cost of an item by the total annual cost of all items. This will give a percentage figure which gives an idea of how valuable the items are individually.
And once that has been done, you can sort them from largest to smallest to get a clear overview.
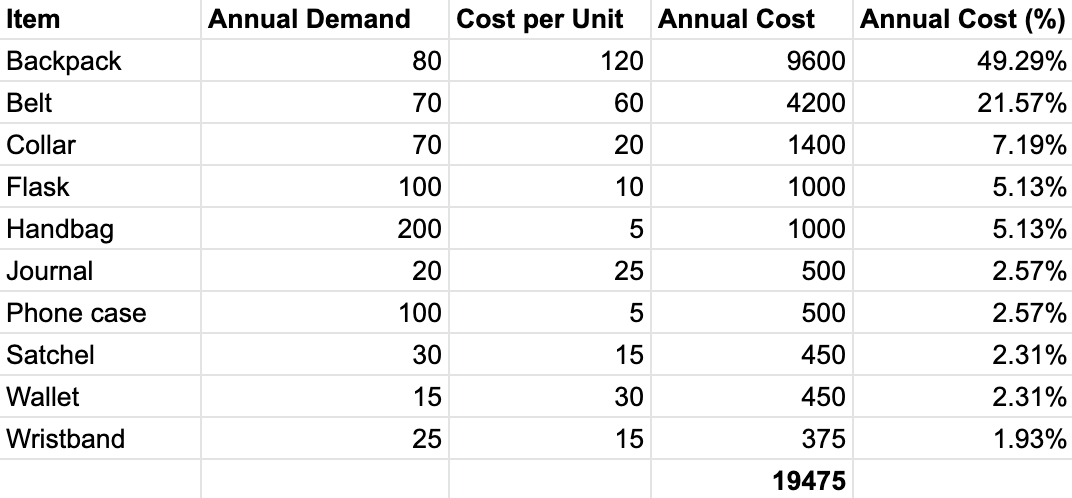
With this information, we can see, right in front of us,which products have the most and least usage value.
This is where the magic happens.
Apply the general rule of thumb for ABC inventory management as mentioned before:
- Item A — The top 15% represent 70% of sales
- Item B — The middle 20% represents 20% of sales
- Item C — The bottom 65% represents 10% of sales
Starting with item A, we are looking for around the top 15% of products to bring 70% of sales. In this case, we can see that backpacks alone only bring around 50% of the total annual cost. But once you also add belts into the mix, then we can see that we have just over 70% of sales.
There we have it, backpacks and belts are designated as item A.
Obviously, this doesn’t have to be precise, and the values in this example are quite crude, but you will be surprised to find out how often this pattern works.
So anyway, now we can look to see what item Bs are going to be.
Adding up collars, flasks, and handbags takes us to just over 17%. We could add journals to get to 20% of sales but there is a clear distinction between the annual cost of journals and phone cases.
It makes sense to draw the line there.
And everything below that line, as the weakest of our stock, is going to be classified as item C.
Here is the final picture for clarity:
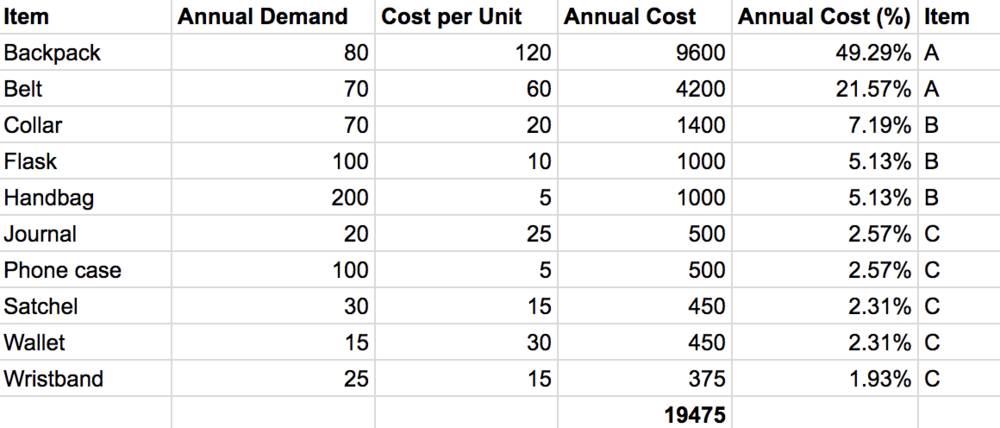
You can do the exact same process yourself with a simple spreadsheet.
Just note that the purpose here is to distinguish items from each other in terms of their usage value. Don’t worry about the numbers matching up exactly.
Think about the purpose of this exercise in classifying your products effectively.
How to use ABC analysis in inventory management?

Now you’ve gone and done your calculations. The question is, how do you realize the importance of ABC inventory analysis? Here are six ways you can take full advantage:
- Optimize inventory — You can make sure that you are well-stocked on A items and have low stock on C items, and ABC gives you a plan of action for it
- Improved pricing — Sorting your products by demand means calculating selling price accurately, potentially raising profits
- Set appropriate safety nets — This kind of analysis allows you to understand at what point a product is in its life, so you can determine the correct safety stock levels
- Prioritize products — Items in the A category can have more attention and resources allocated to them, allowing better strategic decisions
- Targeted customer service — You can now make sure that your highest-value customers get extra attention
- Track materials efficiently — You can manage your raw materials efficiently by having a greater grasp on your finished products
Pro tip: Incorporate your classifications into your SKU system.
That way, everyone in the business can immediately see which products should be given priority.
How ABC analysis is done for customers?

The cool thing about ABC inventory is that the same principles can be applied across your business. One option is to group your customers into the ones that bring the most and least value to your business. It’s great to start rewarding your loyal customers by paying them extra attention.
By now, it shouldn’t come across as a surprise that you can use this method in more places than just ABC inventory. The same methods of ABC analysis can be applied to your customer base. You might be asking: what’s the point of that? Well, the benefits are many-fold.
For one, by knowing which customers are most valuable, you can allocate greater attention to them — both in terms of support and giving them more of what they want.
But even more important is that having three classifications in front of you means that you can make strategic decisions with what otherwise would be complex sets of data.
For example, if you found that most of your A customers were millennials, you could adjust your marketing strategy accordingly.
Or you can prioritize orders in your enterprise manufacturing software to ensure that your A customers get their deliveries on time in times of high demand.
The only thing is that performing this kind of analysis well is a little more complicated than ABC inventory. As well as profits the customers bring, you want to try and investigate:
- Support costs
- Current revenue
- Potential revenue
On top of these, you can add anything else that could give a more accurate overview of the value your customers bring. Once you have the details in front of you, though, there will be little doubt as to the potential boosts it can offer your business.
Getting the most out of ABC inventory
It’s funny that an Italian engineer from the 19th century came up with a principle that is helping set manufacturers up for success to this day. A strategy that simplifies complicated data sets and gives you a perspective with which you can strategize across your business. That’s from inventory to customers to computer bugs.
But to really get the most out of your ABC inventory analysis, you will need the tools to back you up. Because understanding is one thing, implementation is another.
Katana’s manufacturing inventory software offers advanced inventory planning features including automatic reorder points and safety stock calculations for all your SKUs, making it easy to follow the ABC inventory strategy.
Otherwise, all that work will have gone to waste.
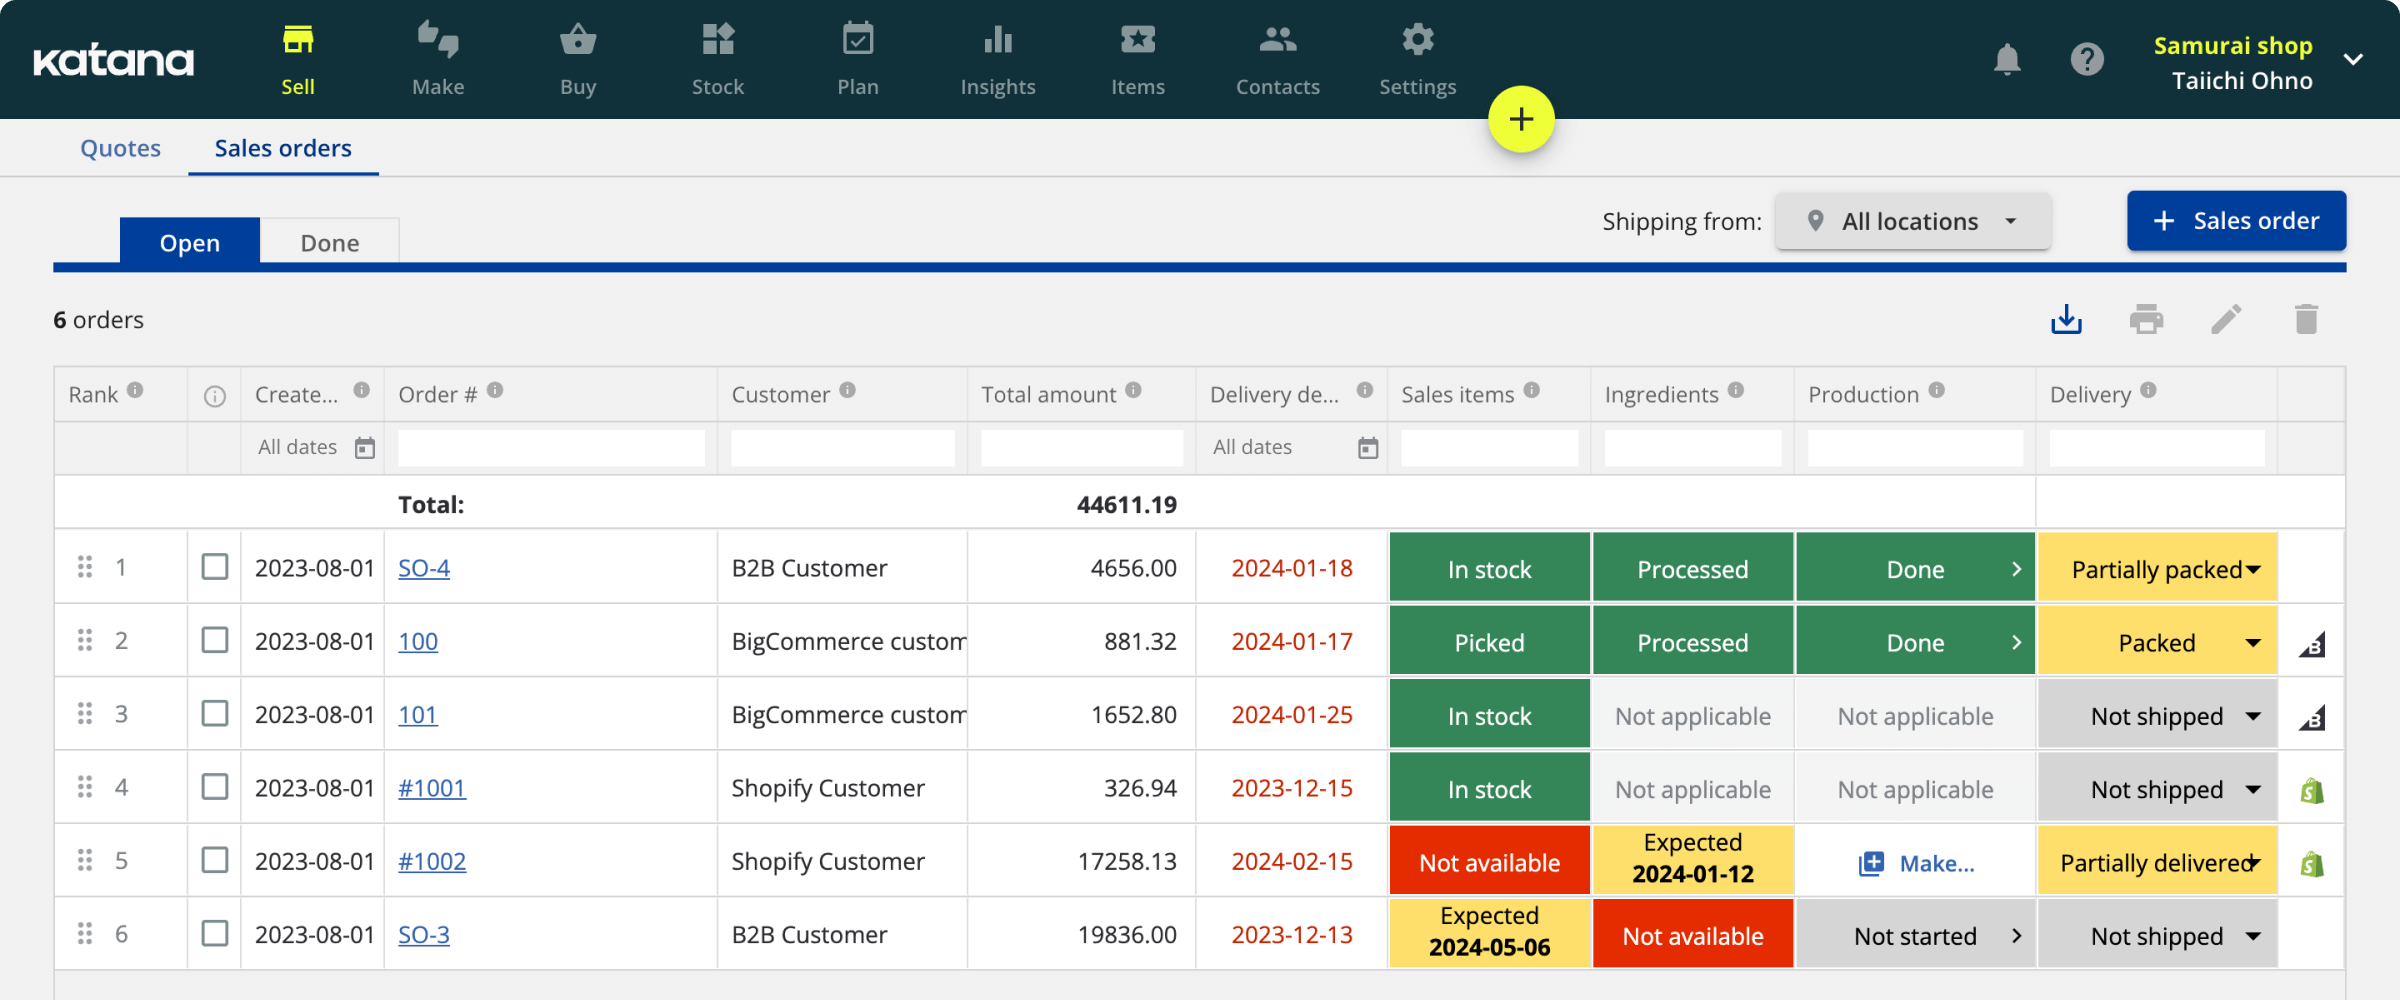
Seeing all your orders in one place makes it much easier to react to the strategies that ABC inventory helps put in place. With Katana, you can set your reorder points while also putting your sales and production together in one platform.
It’s an ideal way to put your ABC inventory into action because all your demand is right in front of you — in real time.
Mr. Pareto would be proud.
More on inventory management


Get visibility over your sales and stock
Wave goodbye to uncertainty by using Katana Cloud Inventory for total inventory control