Inventory reporting for better business decisions
Inventory reporting is part of any business dealing with some kind of stock movement. Learning how to do it efficiently can save you a lot of time and effort.

If you got into manufacturing because you like to create products, reporting may not be your favorite thing. But inventory reporting is an essential practice in any business, no matter how dull you may find it. So, it’s better to learn how to do it well and efficiently.
This article will explore the ins and outs of inventory reporting, including inventory reporting methods, metrics, and how to use them in your business.
By the end of this article, you’ll better understand inventory reporting and how to make it easier for yourself. Let’s get started!
What is an inventory report?
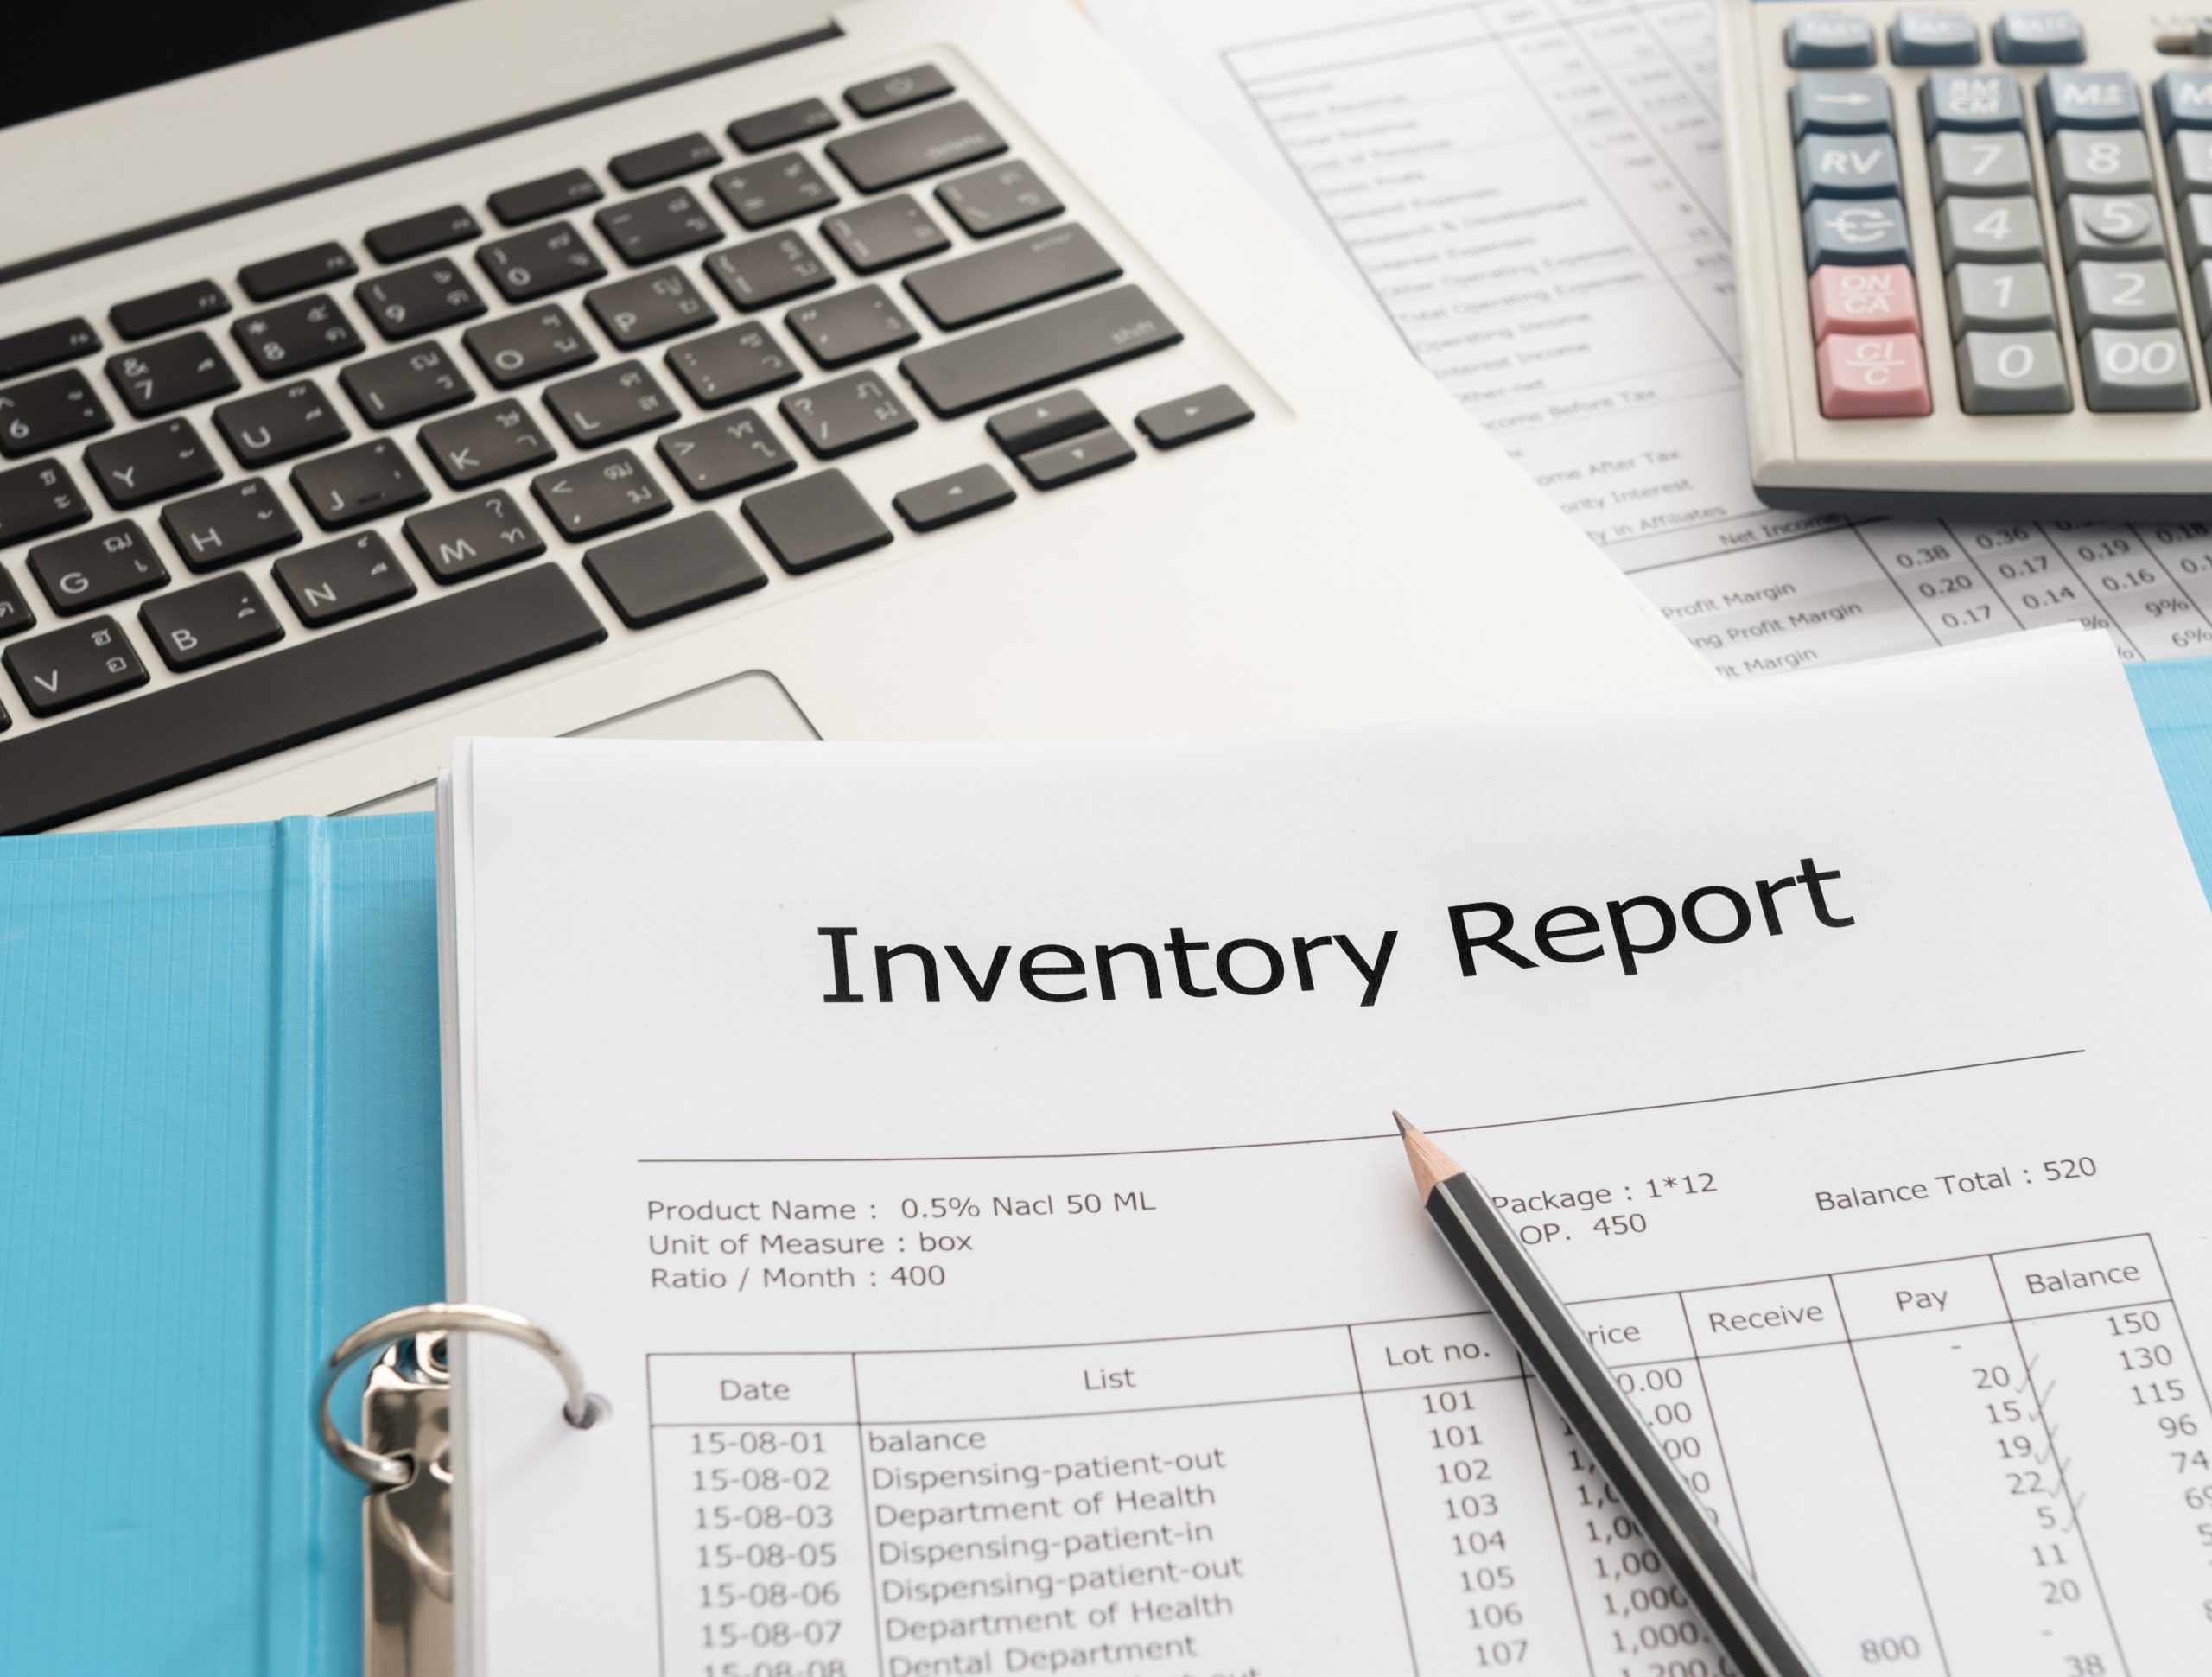
An inventory report is a document that provides a detailed account of the quantity, location, and status of a company’s inventory. Businesses typically use it to track various inventory reporting metrics that help them stay on top of their stock levels, monitor changes in inventory over time, and make informed decisions about purchasing, production, and sales.
Inventory reports can include information such as:
- Item descriptions — A detailed description of each item in the inventory
- Quantity on hand — The number of units of each item currently in stock
- Location — The physical location of each item within the warehouse or storage area
- Cost per unit — The cost of each item when purchased or produced
- Total inventory value — The total value of all items in inventory based on their price per unit
- Sales history — A record of the quantity sold and the revenue generated for each item over a specific period
- Reorder point — The quantity at which the items should be reordered to avoid stockouts
- Lead time — The time it takes to manufacture or for a supplier to deliver an order of a specific item
Inventory reports can be generated using software designed for inventory management and reporting or through manual tracking methods such as spreadsheets. Various departments can use them within a company, such as purchasing, production, and sales, to ensure that the inventory is managed efficiently and effectively.
Types of inventory reports

There are several inventory reporting methods that businesses can use, depending on their needs and the level of detail they require. Most companies are aware of stock availability reports and stock count reports, but there are many others that can provide invaluable insights. Here are some of the most common inventory reports:
- Inventory valuation — Estimates the total value of a company’s inventory based on the cost of each item and the quantity on hand. This report is useful for financial reporting purposes and can help businesses track the value of their inventory over time.
- Stock movement — Shows the movement of goods in and out of a company’s inventory, including sales, returns, and stock transfers. It can help businesses identify trends in their inventory levels and adjust their ordering and restocking strategies accordingly.
- Reorder — Identifies items that are low in stock or out of stock and need to be reordered. Businesses can use this report to avoid stockouts and ensure that they have enough inventory to meet customer demand.
- ABC analysis — Categorizes inventory items into three groups based on their value: A items (high-value items that account for a large percentage of revenue), B items (medium-value items), and C items (low-value items). This report can help businesses prioritize their inventory management efforts and focus on the items that are most important to their bottom line.
- Dead stock — Identifies items that have not sold in a long time and are taking up valuable warehouse space. This report can help businesses identify slow-moving inventory and make decisions about discounting, liquidating, or disposing of those items.
These are just a few examples of the types of inventory reports that businesses can generate. By analyzing these reports and using the insights they provide, businesses can make informed decisions about their inventory management strategies and improve their overall efficiency and profitability.
How to create an inventory report
Creating an inventory report can be a straightforward process, depending on the size and complexity of your inventory. Here are the general steps to create an inventory report:
- Choose your inventory tracking method — Before creating an inventory report, you need to decide on the method you will use to track your inventory. This can be a manual method, such as using a spreadsheet or paper forms, or an automated method using live inventory management software.
- Collect inventory data — Once you have decided on your inventory tracking method, you need to collect data about your inventory. This includes information such as the item name, item code or SKU, quantity on hand, location of the item, and any other relevant information about the product or inventory.
- Organize and analyze the data — After collecting the inventory data, organize it in a logical manner that makes sense for your business. Depending on your needs, you may want to categorize your inventory by product type, location, or other factors. Once the data is organized, you can begin to analyze it to identify trends and insights about your inventory.
- Choose the type of inventory report — Based on your inventory tracking method, you can choose the type of inventory report that best suits your needs. This could be an inventory valuation, a stock movement, a reorder, or any other type of report that meets your requirements.
- Create the report — Once you have chosen the type of report, you can use your inventory data to create the report. Be sure to include all the relevant data that you previously collected.
- Review and update the report regularly — Inventory levels can change quickly, so it’s important to review and update your inventory report regularly to ensure that it accurately reflects your current inventory levels. This will help you make informed decisions about inventory management and ensure that you have the right products on hand to meet customer demand.
How often should you generate inventory reports?

The frequency at which you generate inventory reports depends on the size and complexity of your inventory and your business needs. However, as a general guideline, it’s recommended to generate inventory reports on a regular basis, such as weekly, monthly, or quarterly.
For businesses with a large inventory or high sales volume, generating inventory reports more frequently, such as daily or weekly, may be necessary to ensure that inventory levels are closely monitored and managed. This is particularly important for businesses that sell perishable goods or have a high turnover rate.
On the other hand, businesses with a smaller inventory or lower sales volume may be able to generate inventory reports less frequently, such as monthly or quarterly. However, it’s still important to regularly review and update inventory levels to ensure that you have the right products on hand to meet customer demand and minimize the risk of stockouts.
Ultimately, the frequency at which you generate inventory reports should be based on your business needs and the level of visibility you require over your inventory levels. By regularly generating inventory reports, you can better manage your inventory, reduce the risk of stockouts, and make informed decisions about what products to stock and at what levels. This, in turn, can help you maximize profits and better serve your customers.
Automate inventory reporting with Katana
If you’re looking for a way to streamline your inventory reporting process and gain real-time visibility into your inventory levels, consider using Katana.
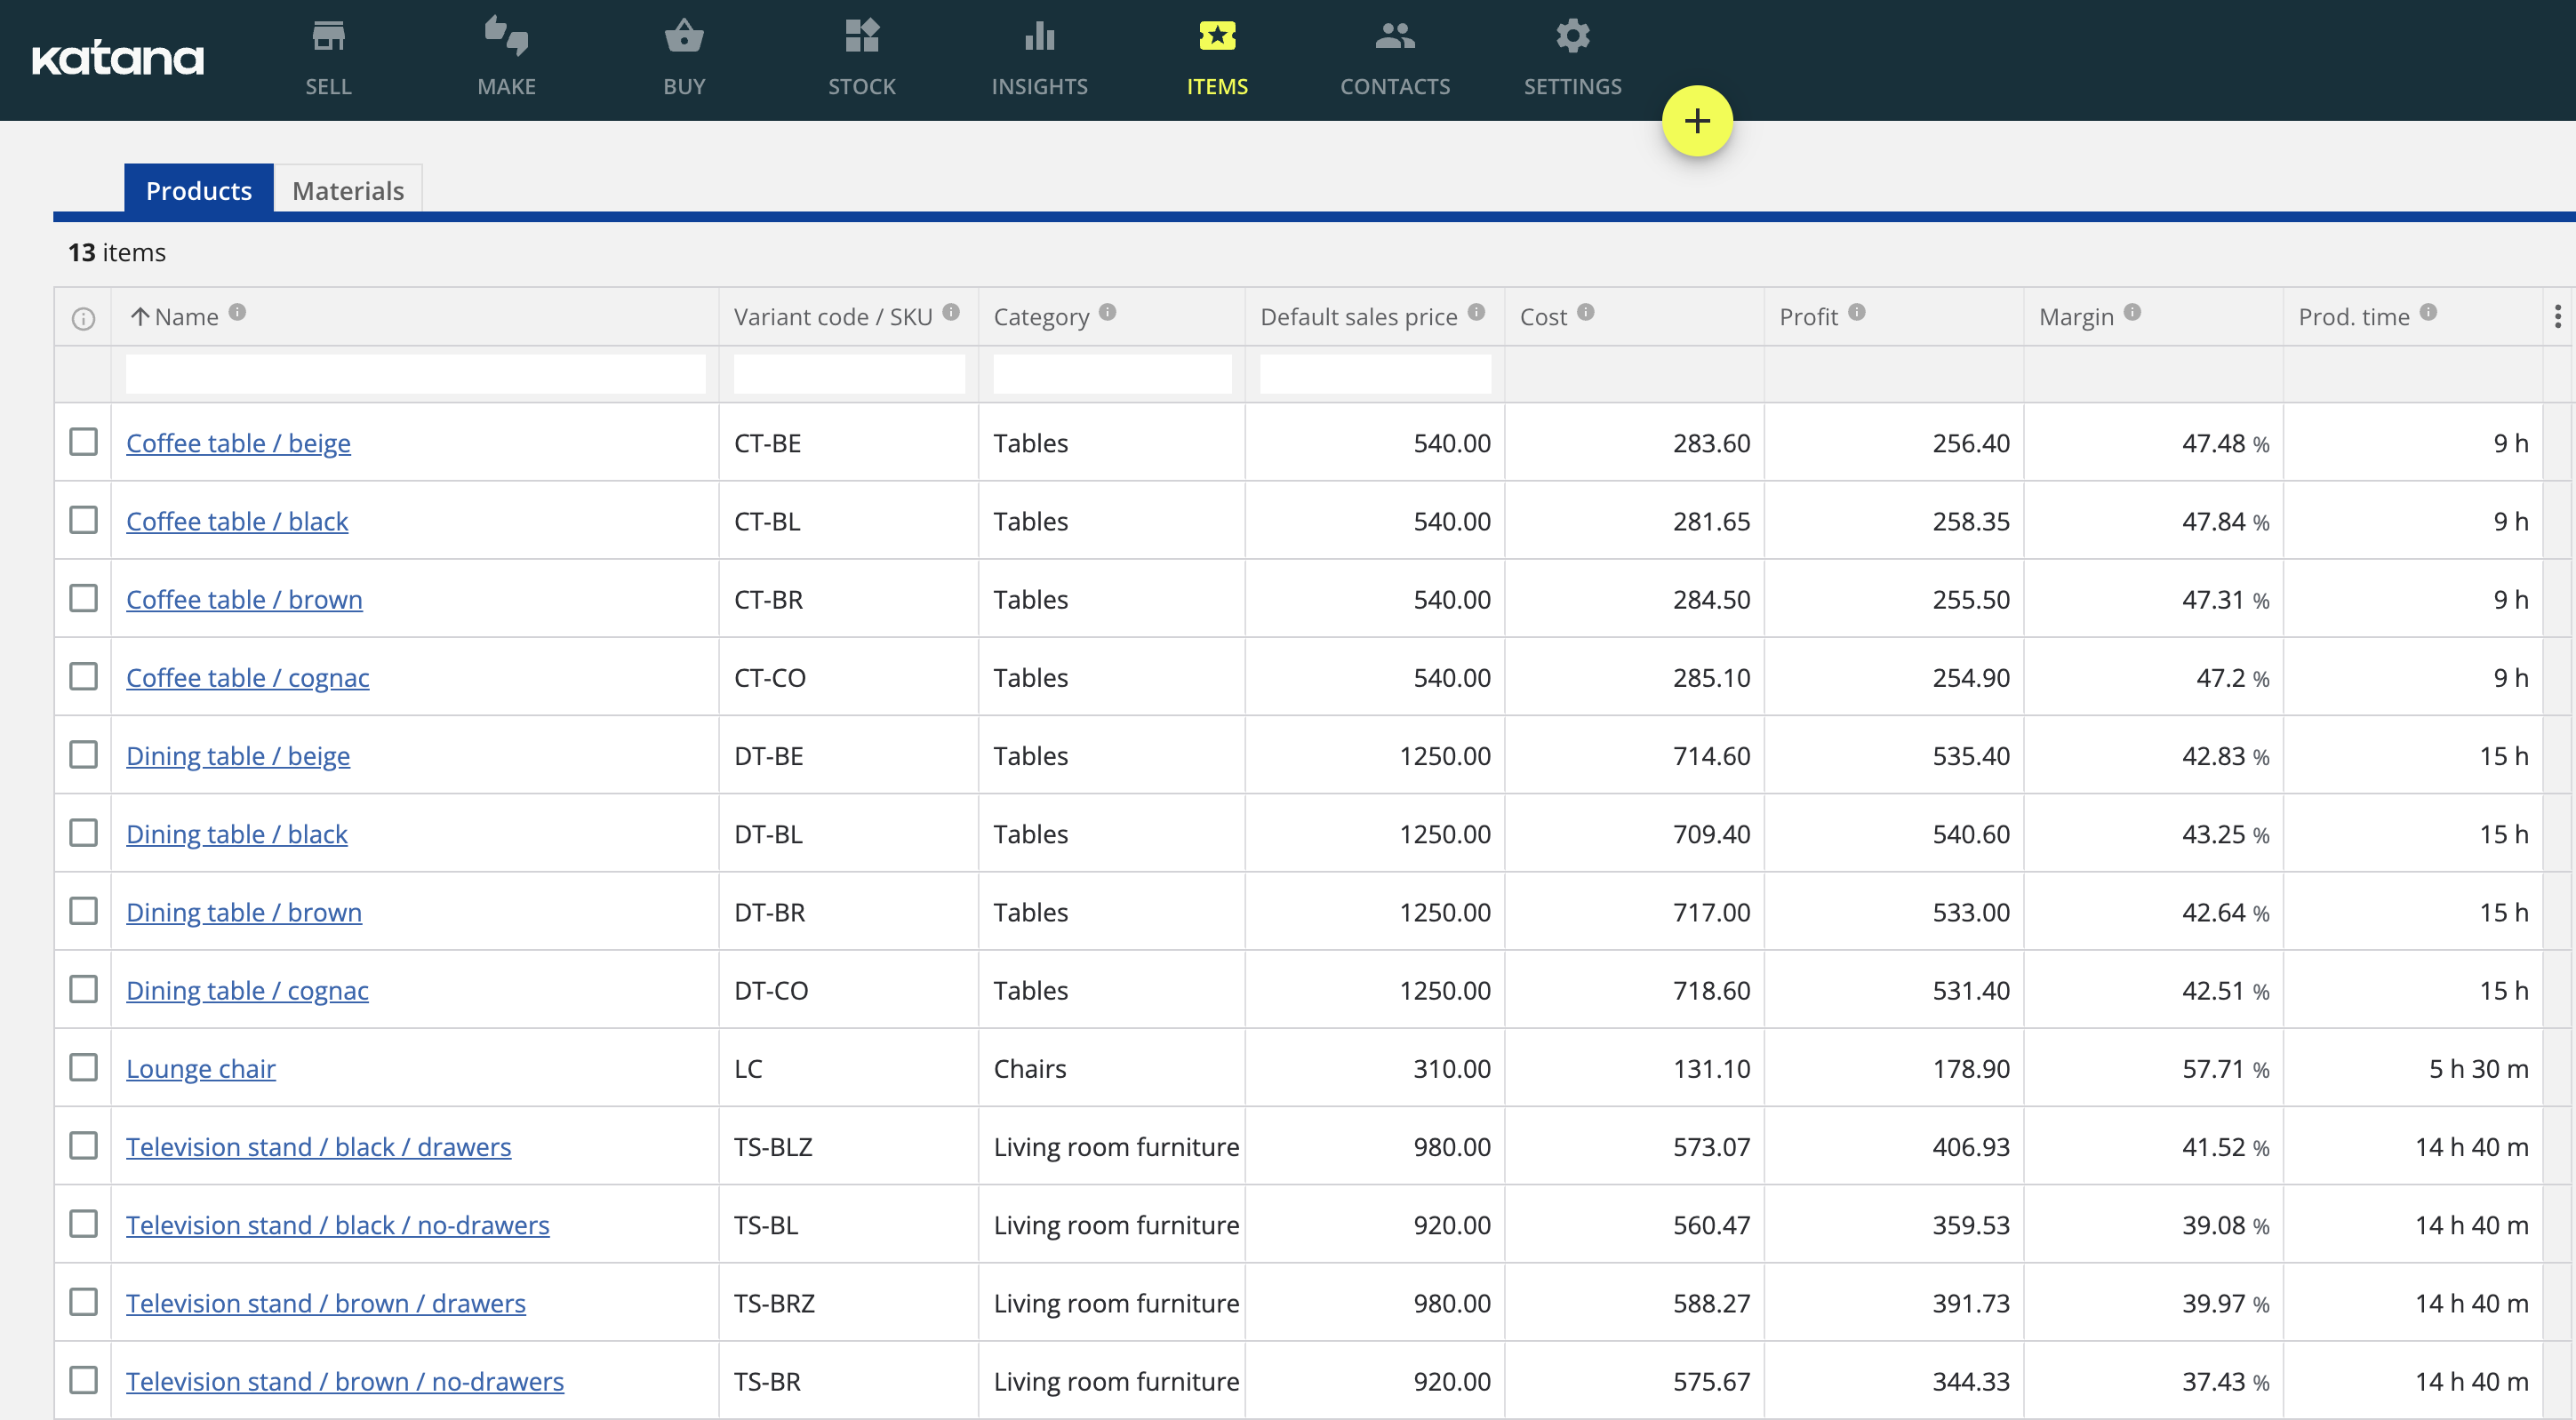
Katana is a cloud inventory software that allows businesses to automate their inventory reporting process. With Katana, you can easily track your inventory levels, set up reorder points, and generate reports that provide insights into your inventory performance.
Some of the benefits of using Katana for inventory reporting include:
- Real-time inventory tracking — Track your raw materials, work-in-progress, and finished goods in real-time
- Reorder points — Set up reorder points for your inventory items so you never run out of stock
- Sales insights — A single source of truth to track your sales performance and make data-driven decisions
- Integrations — Katana integrates with a range of popular e-commerce platforms, such as Shopify and WooCommerce, as well as accounting software like QuickBooks Online and Xero, and a lot of other business tools enabling you to do anything from shipping to reporting
Automating your inventory reporting process with Katana can save time and reduce the risk of manual errors. Get started by booking a demo and ensure you always have the right products to meet customer demand.
Get inventory trends, news, and tips every month
Explore all categories
Get visibility over your sales and stock
Wave goodbye to uncertainty with Katana Cloud Inventory — AI-powered for total inventory control
