7 essential inventory management formulas for business success
Managing inventory involves a lot of math. Check out these 7 inventory management formulas to make sure you can make the most economical decision about your inventory.


Contrary to popular belief, manufacturing isn’t only about nailing timber, welding metal, and molding plastic. It also involves a lot of math, mainly to streamline inventory management.
To improve efficiency and reduce waste, knowing when you should order more materials and how much or when you will run out of finished goods is essential.
This article covers the most popular inventory management formulas, so be sure to bookmark the page and come back to it whenever you have to do some inventory calculations.
1. Economic order quantity (EOQ)
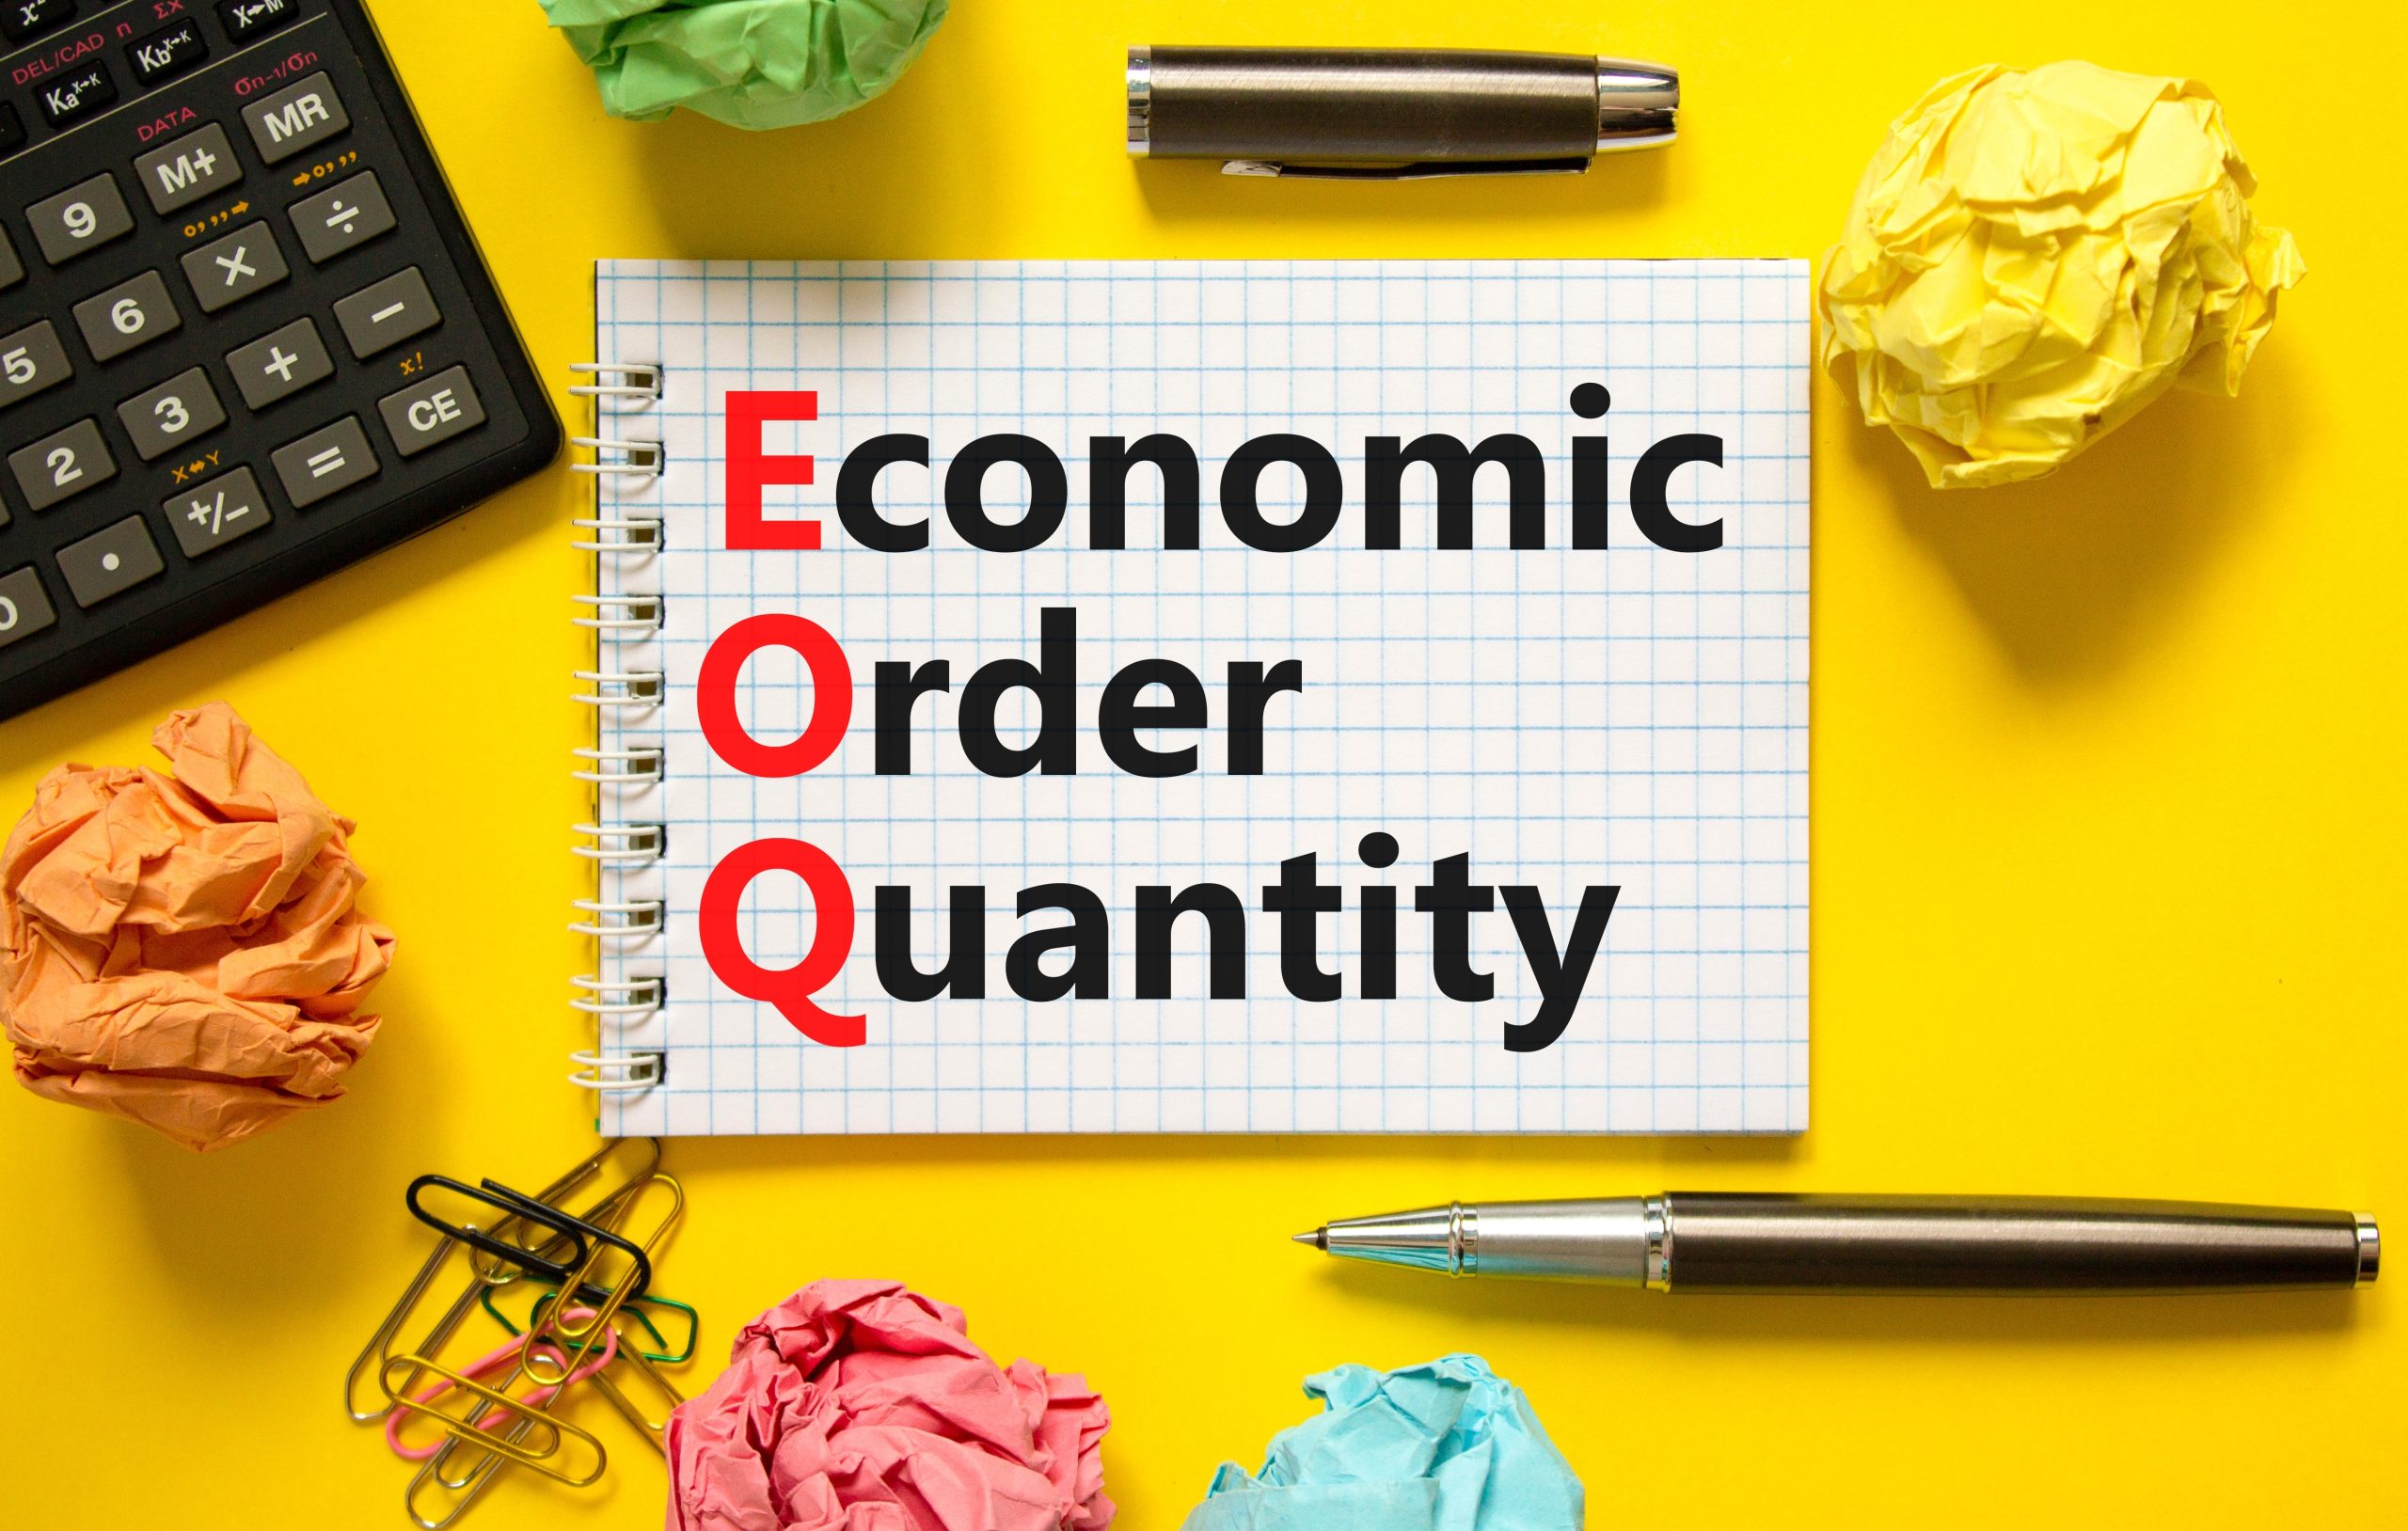
The EOQ is an inventory management formula that determines the optimal order quantity to minimize the total inventory costs. It considers the tradeoff between the setup or ordering costs and the holding or carrying costs. The EOQ formula is widely used in inventory management to help organizations determine how much inventory they should order at one time to reduce their overall costs.
The economic order quantity formula is:
EOQ = √[(2DK)/H]
Where:
- D — Annual demand in units
- K — Ordering costs per order
- H — Carrying costs per unit per year
Let’s see what it would look like with an example.
A company wants to order inventory for a product with an annual demand of 1,000 units, an ordering cost of $500, and a holding cost of $2 per unit per year. Using the EOQ formula, the calculation would look like this:
EOQ = √[(2 x 1,000 x 500) / 2]
EOQ = √500,000 = 707
This means the most economical order size is 707 units.
2. Reorder point (ROP)
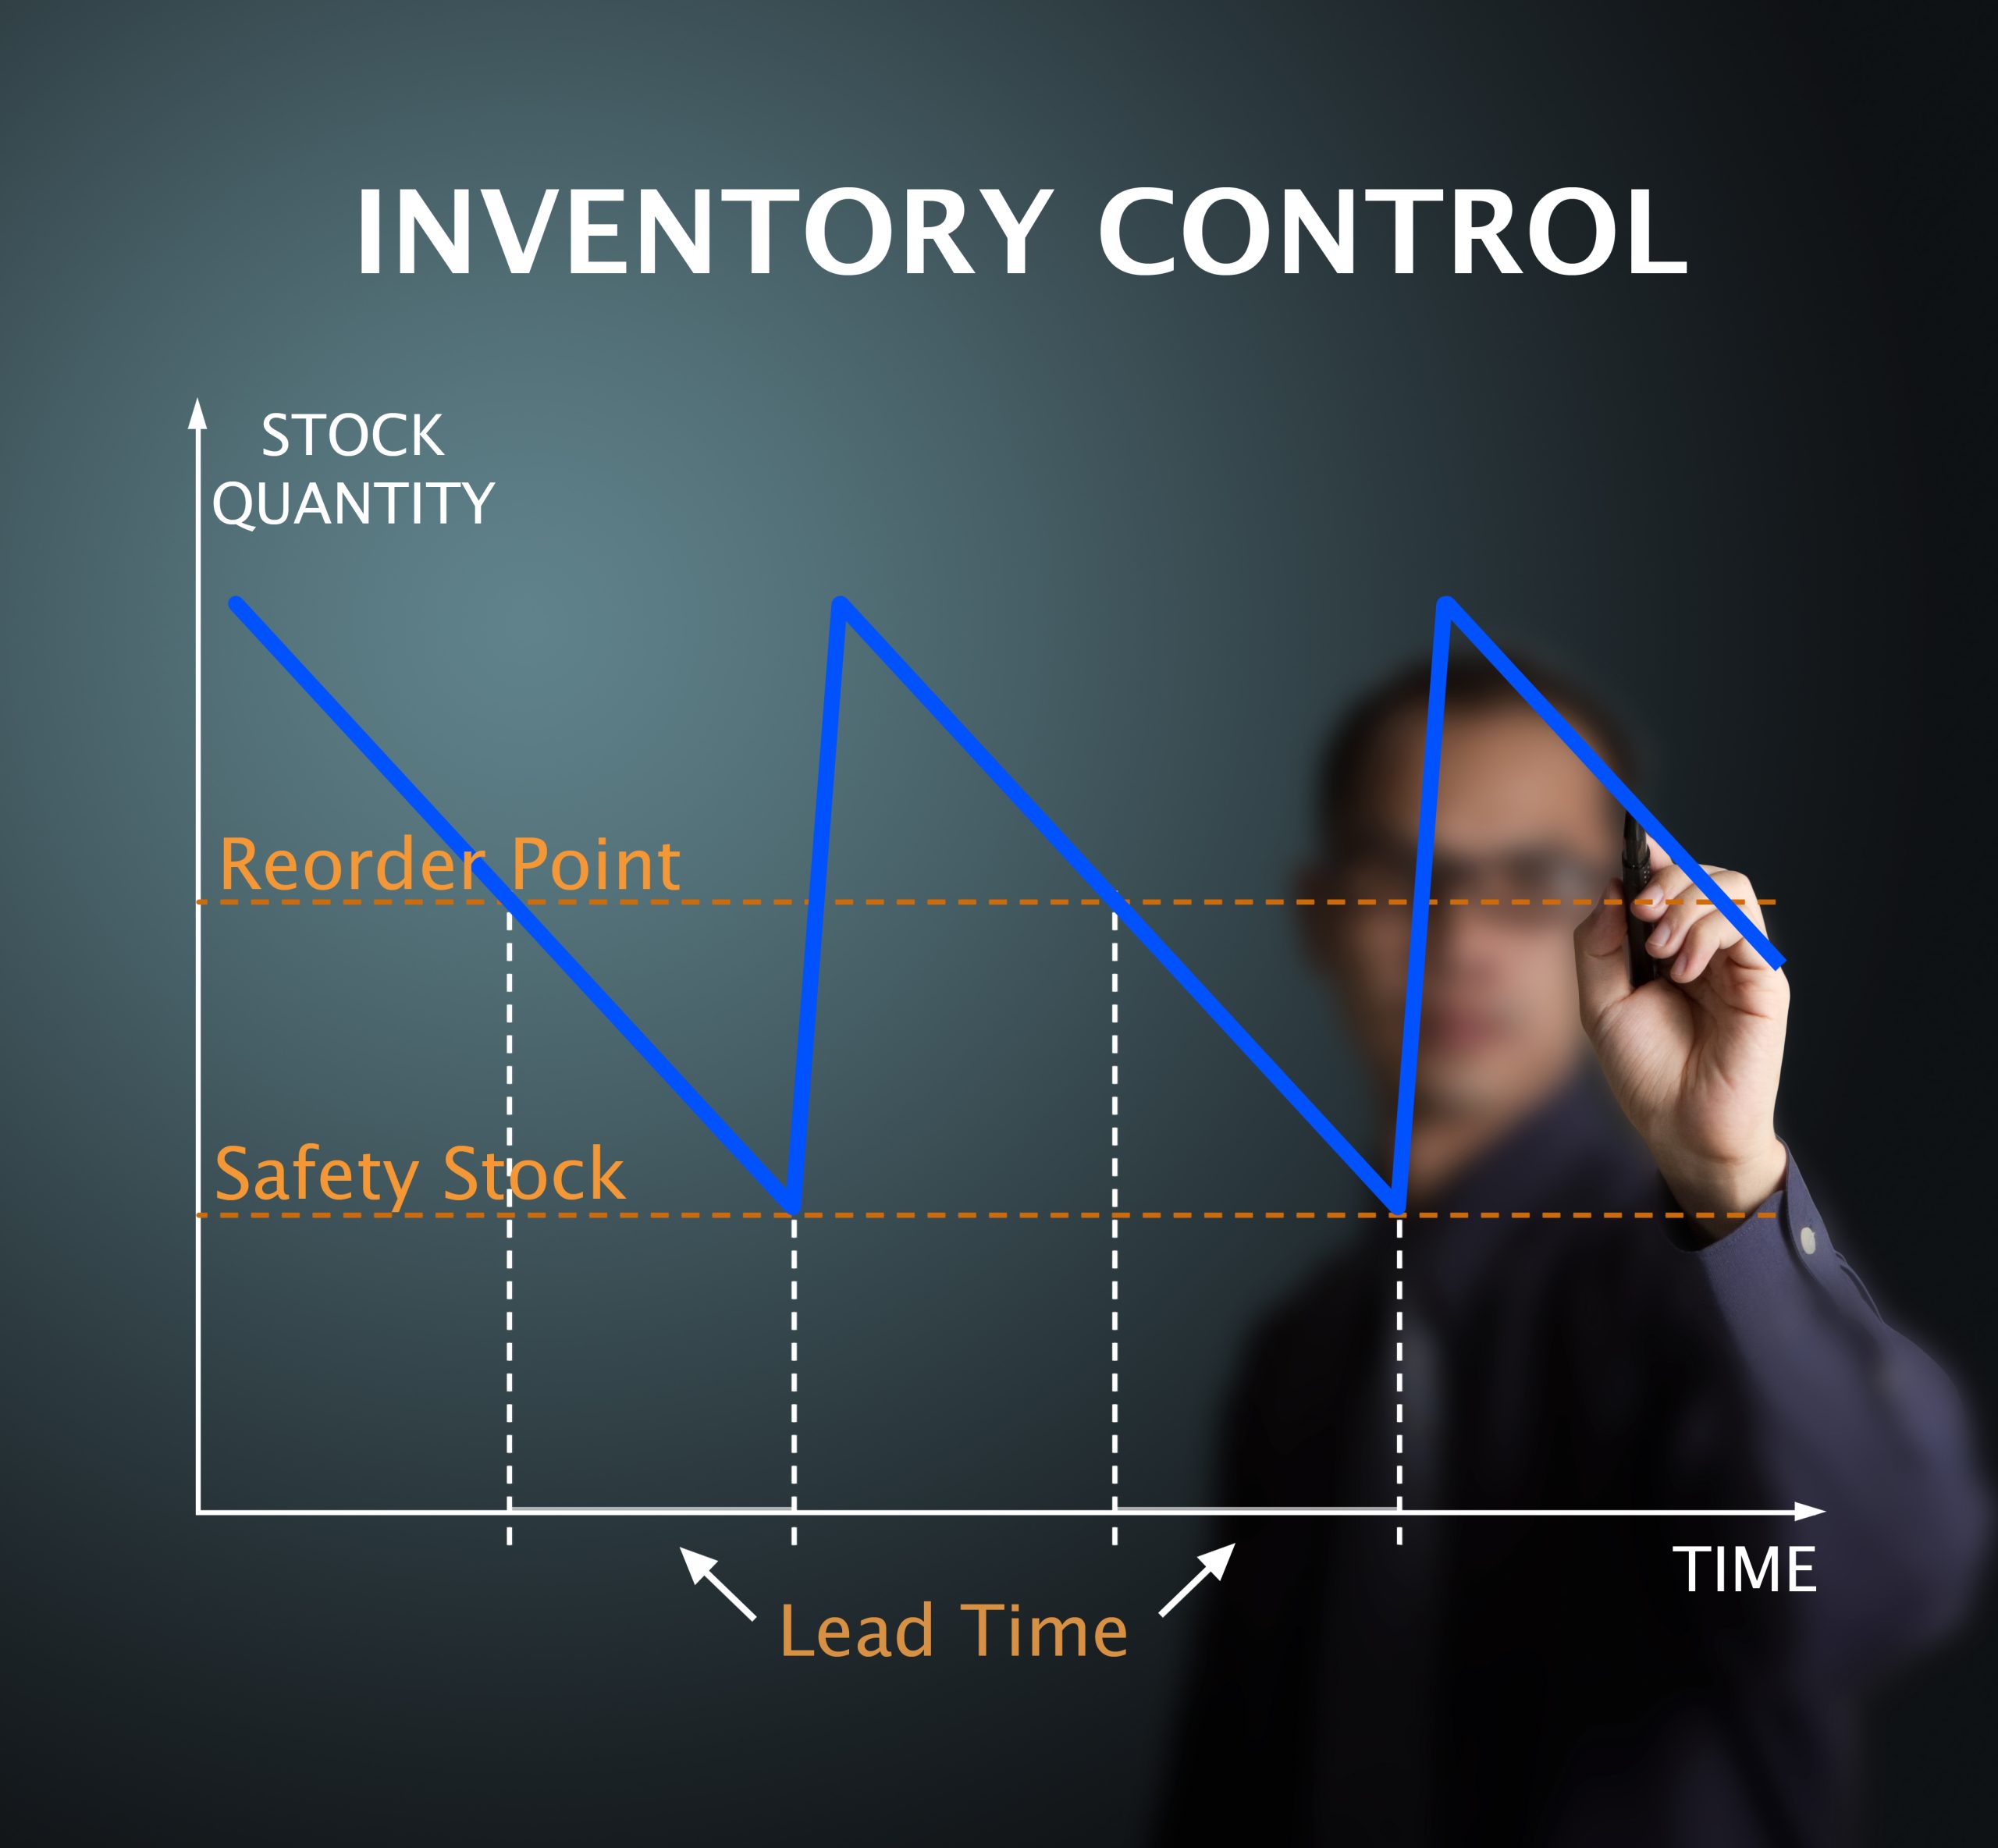
The ROP is another inventory management formula. It calculates the minimum inventory level at which a new order must be placed to meet customer demand and avoid stockouts. The reorder point formula considers the average daily demand, lead time, and safety stock.
The formula is:
ROP = (Average daily demand x lead time) + safety stock
Where:
- Average daily demand — Total annual demand / 365
- Lead time — The time it takes to receive the order after placing it
- Safety stock — Buffer stock to cover unexpected demand or lead time variations
Let’s plug some sample numbers into this inventory formula to see what it would look like.
A company has an average daily demand of 50 units, a lead time of 10 days, and a safety stock of 100 units. So, the calculation would be the following:
ROP = (50 x 10) + 100 = 600
Therefore, the company should set up a new order as soon as the inventory falls to 600 units.
3. Safety stock
The safety stock formula is used to calculate the additional inventory held to mitigate the risk of stockouts. There are multiple different ways to calculate safety stock. There are specific formulas for when you have chaotic demand or are uncertain about your lead times. These particular formulas can get quite complex.
Check out this in-depth article about calculating safety stock for more advanced formulas.
For the rest of us, the formula is:
Safety stock = (Maximum daily usage x maximum lead time days) – (average daily usage x average lead time days)
Suppose a company sells a product with an average daily usage of 50 units and an average lead time of 5 days. The company wants to maintain a safety stock to cover unexpected demand or lead time variations. This product’s estimated daily usage is 80 units, and the maximum lead time is 7 days.
Using the safety stock formula, we can calculate the amount of safety stock needed for this product as follows:
Safety stock = (80 x 7) – (50 x 5)
Safety stock = 560 – 250 = 310 units
Therefore, the company should maintain a safety stock of 310 units for this product to ensure enough inventory to cover any unexpected demand or lead time variations.
Download the ultimate guide to inventory management
A comprehensive ebook with everything you need to know about inventory management.
4. Carrying cost
The carrying cost formula determines the cost of holding inventory, including storage, handling, and financing costs. The formula uses the average inventory level and the cost of carrying one unit of inventory per year.
Companies use the carrying cost formula to calculate the cost of holding inventory and make decisions about inventory management.
The formula itself looks like this, and it gives you the percentage of your inventory carrying cost:
Inventory carrying cost = Total cost of holding inventory / total value of inventory x 100
Let’s again take a look at an example.
A company that wants to calculate the carrying cost of its inventory. It has a total inventory value of $500,000, and the total cost of holding inventory, which includes storage, handling, and financing costs, is $25,000.
Using the above inventory management formula, we can calculate the carrying cost as follows:
Inventory carrying cost = ($80,000 / $500,000) x 100 = 0.16 x 100 = 16%
Therefore, the carrying cost of the company’s inventory is 16% of the total inventory value.
5. Inventory turnover ratio
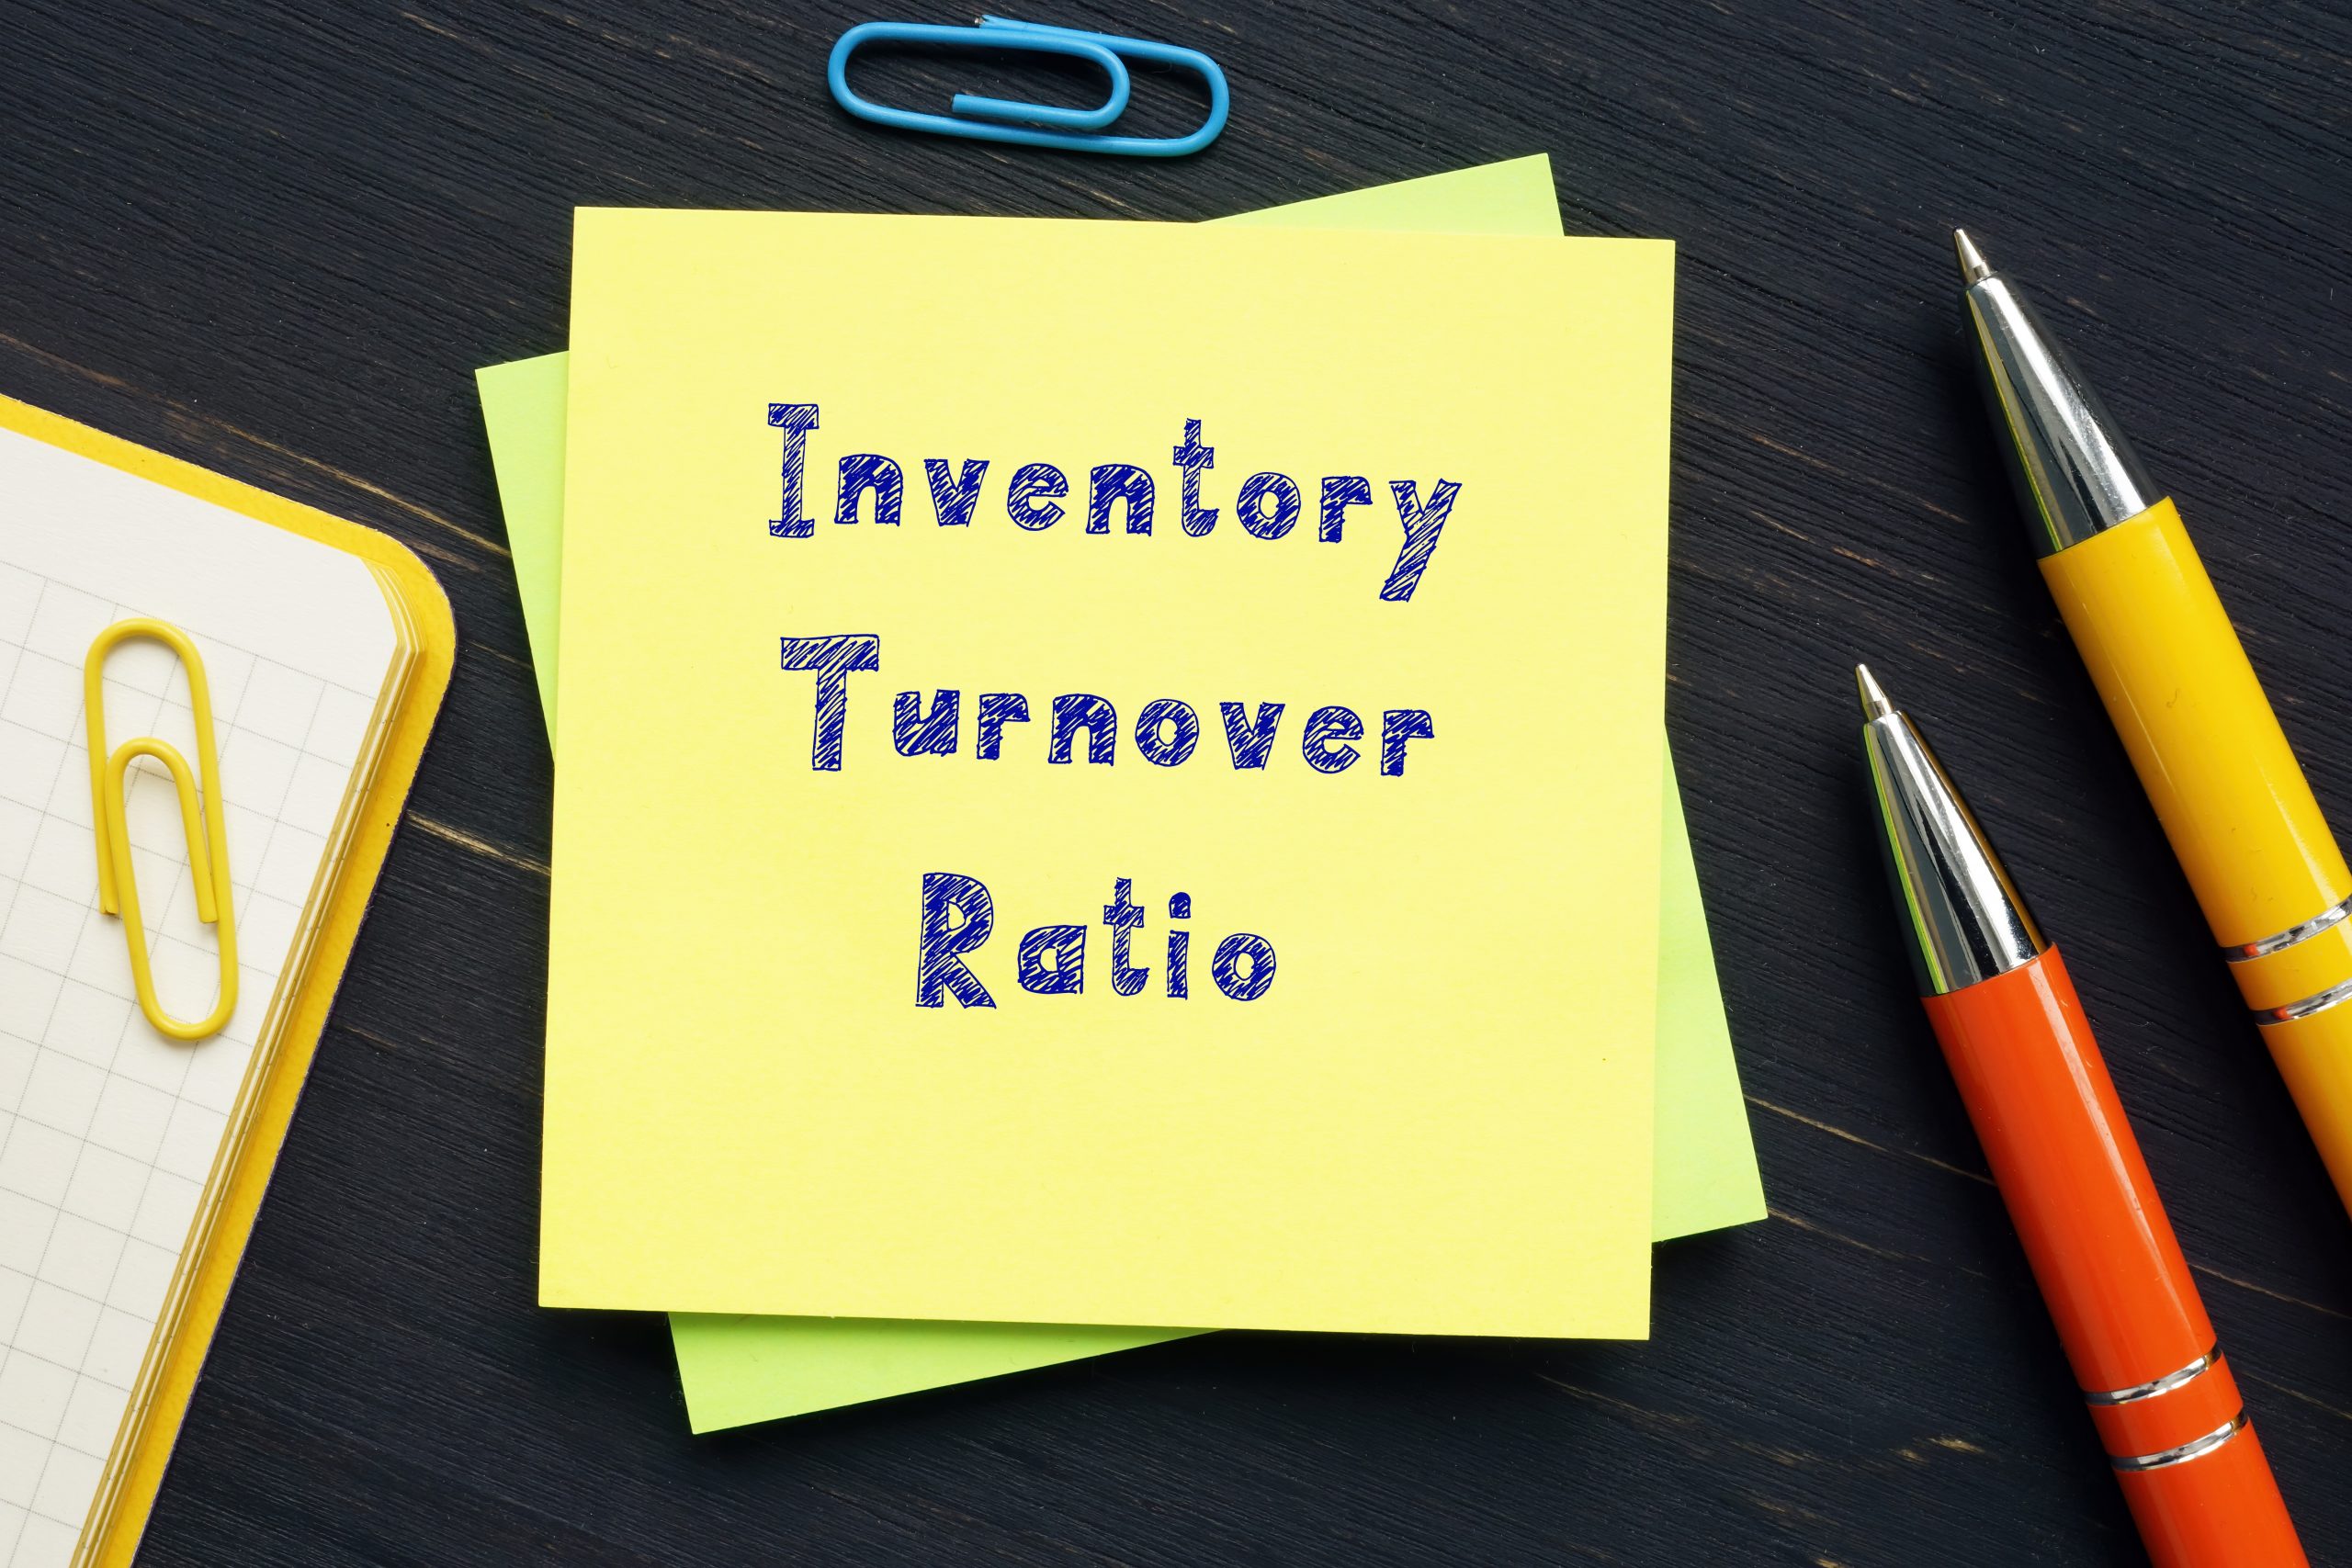
The ITR is an inventory management formula used to calculate the number of times inventory is sold and replaced during a period. It looks at the cost of goods sold (COGS) and the average inventory level.
Businesses use the inventory turnover ratio formula to evaluate the efficiency of their inventory management and make decisions about inventory levels.
The formula looks like this:
Inventory turnover ratio = Cost of goods sold / average inventory level
Where:
- Cost of goods sold — Total cost of goods sold during the period
- Average inventory — (Beginning inventory + ending inventory) / 2
Let’s look at another example.
A company has COGS of $48,000 and a monthly average inventory of $40,000. Let’s plug the numbers into the formula:
Inventory turnover ratio = 48,000 / 40,000 = 1.2
The inventory turnover ratio of 1.2 means that the company sells its entire inventory 1.2 times during the month. If you wish to calculate the days it takes, you can divide the days in the period by the turnover ratio. So, for example, May has 31 days. Therefore the calculation would be the following:
31 / 1.2 = 25.8 days
This means it takes just under 26 days for the company to sell its inventory.
A high inventory turnover ratio suggests that the company efficiently manages its inventory by optimizing inventory levels, reducing obsolete inventory, improving forecasting accuracy, and enhancing sales and marketing strategies. This can reduce carrying costs, leading to improved cash flow and higher profitability.
It’s worth noting that different industries have different inventory turnovers. For example, perishable goods must have a very high turnover to ensure the freshness of the products.
Don’t want to memorize all the inventory formulas?
Katana’s cloud inventory platform has advanced insights, making it easy for you to keep an eye on your inventory data and sales performance from a visual platform without having to reach for a notebook and a calculator every time.
6. Gross margin return on investment
GMROI evaluates the profitability of inventory by comparing the gross margin to the investment in inventory. The GMROI formula uses the gross margin and the average inventory investment.
GMROI formula:
GMROI = Gross margin / average inventory investment
Where:
- Gross margin — Sales revenue – cost of goods sold
- Average inventory — (Beginning inventory + ending inventory) / 2
Let’s consider a retail store that sells clothing. The store has a gross margin of $100,000 and an average inventory investment of $50,000 over a year.
Using the GMROI formula, we can calculate the GMROI ratio as follows:
GMROI = $100,000 / $50,000 = 2
Therefore, the GMROI ratio of the retail store is 2. This ratio indicates that the store earns $2 in gross profit for every dollar invested in inventory.
A high GMROI ratio indicates that the store is efficiently managing its inventory and generating a good return on its investment. In contrast, a low GMROI ratio indicates that the store is not generating enough profit from its inventory and may need to adjust its inventory management practices, such as reducing inventory levels or improving the product mix.
The store can use the GMROI ratio to evaluate the profitability of its inventory and make informed decisions about its inventory management, such as optimizing inventory levels, pricing strategies, and product mix, to maximize its profitability.
7. ABC analysis
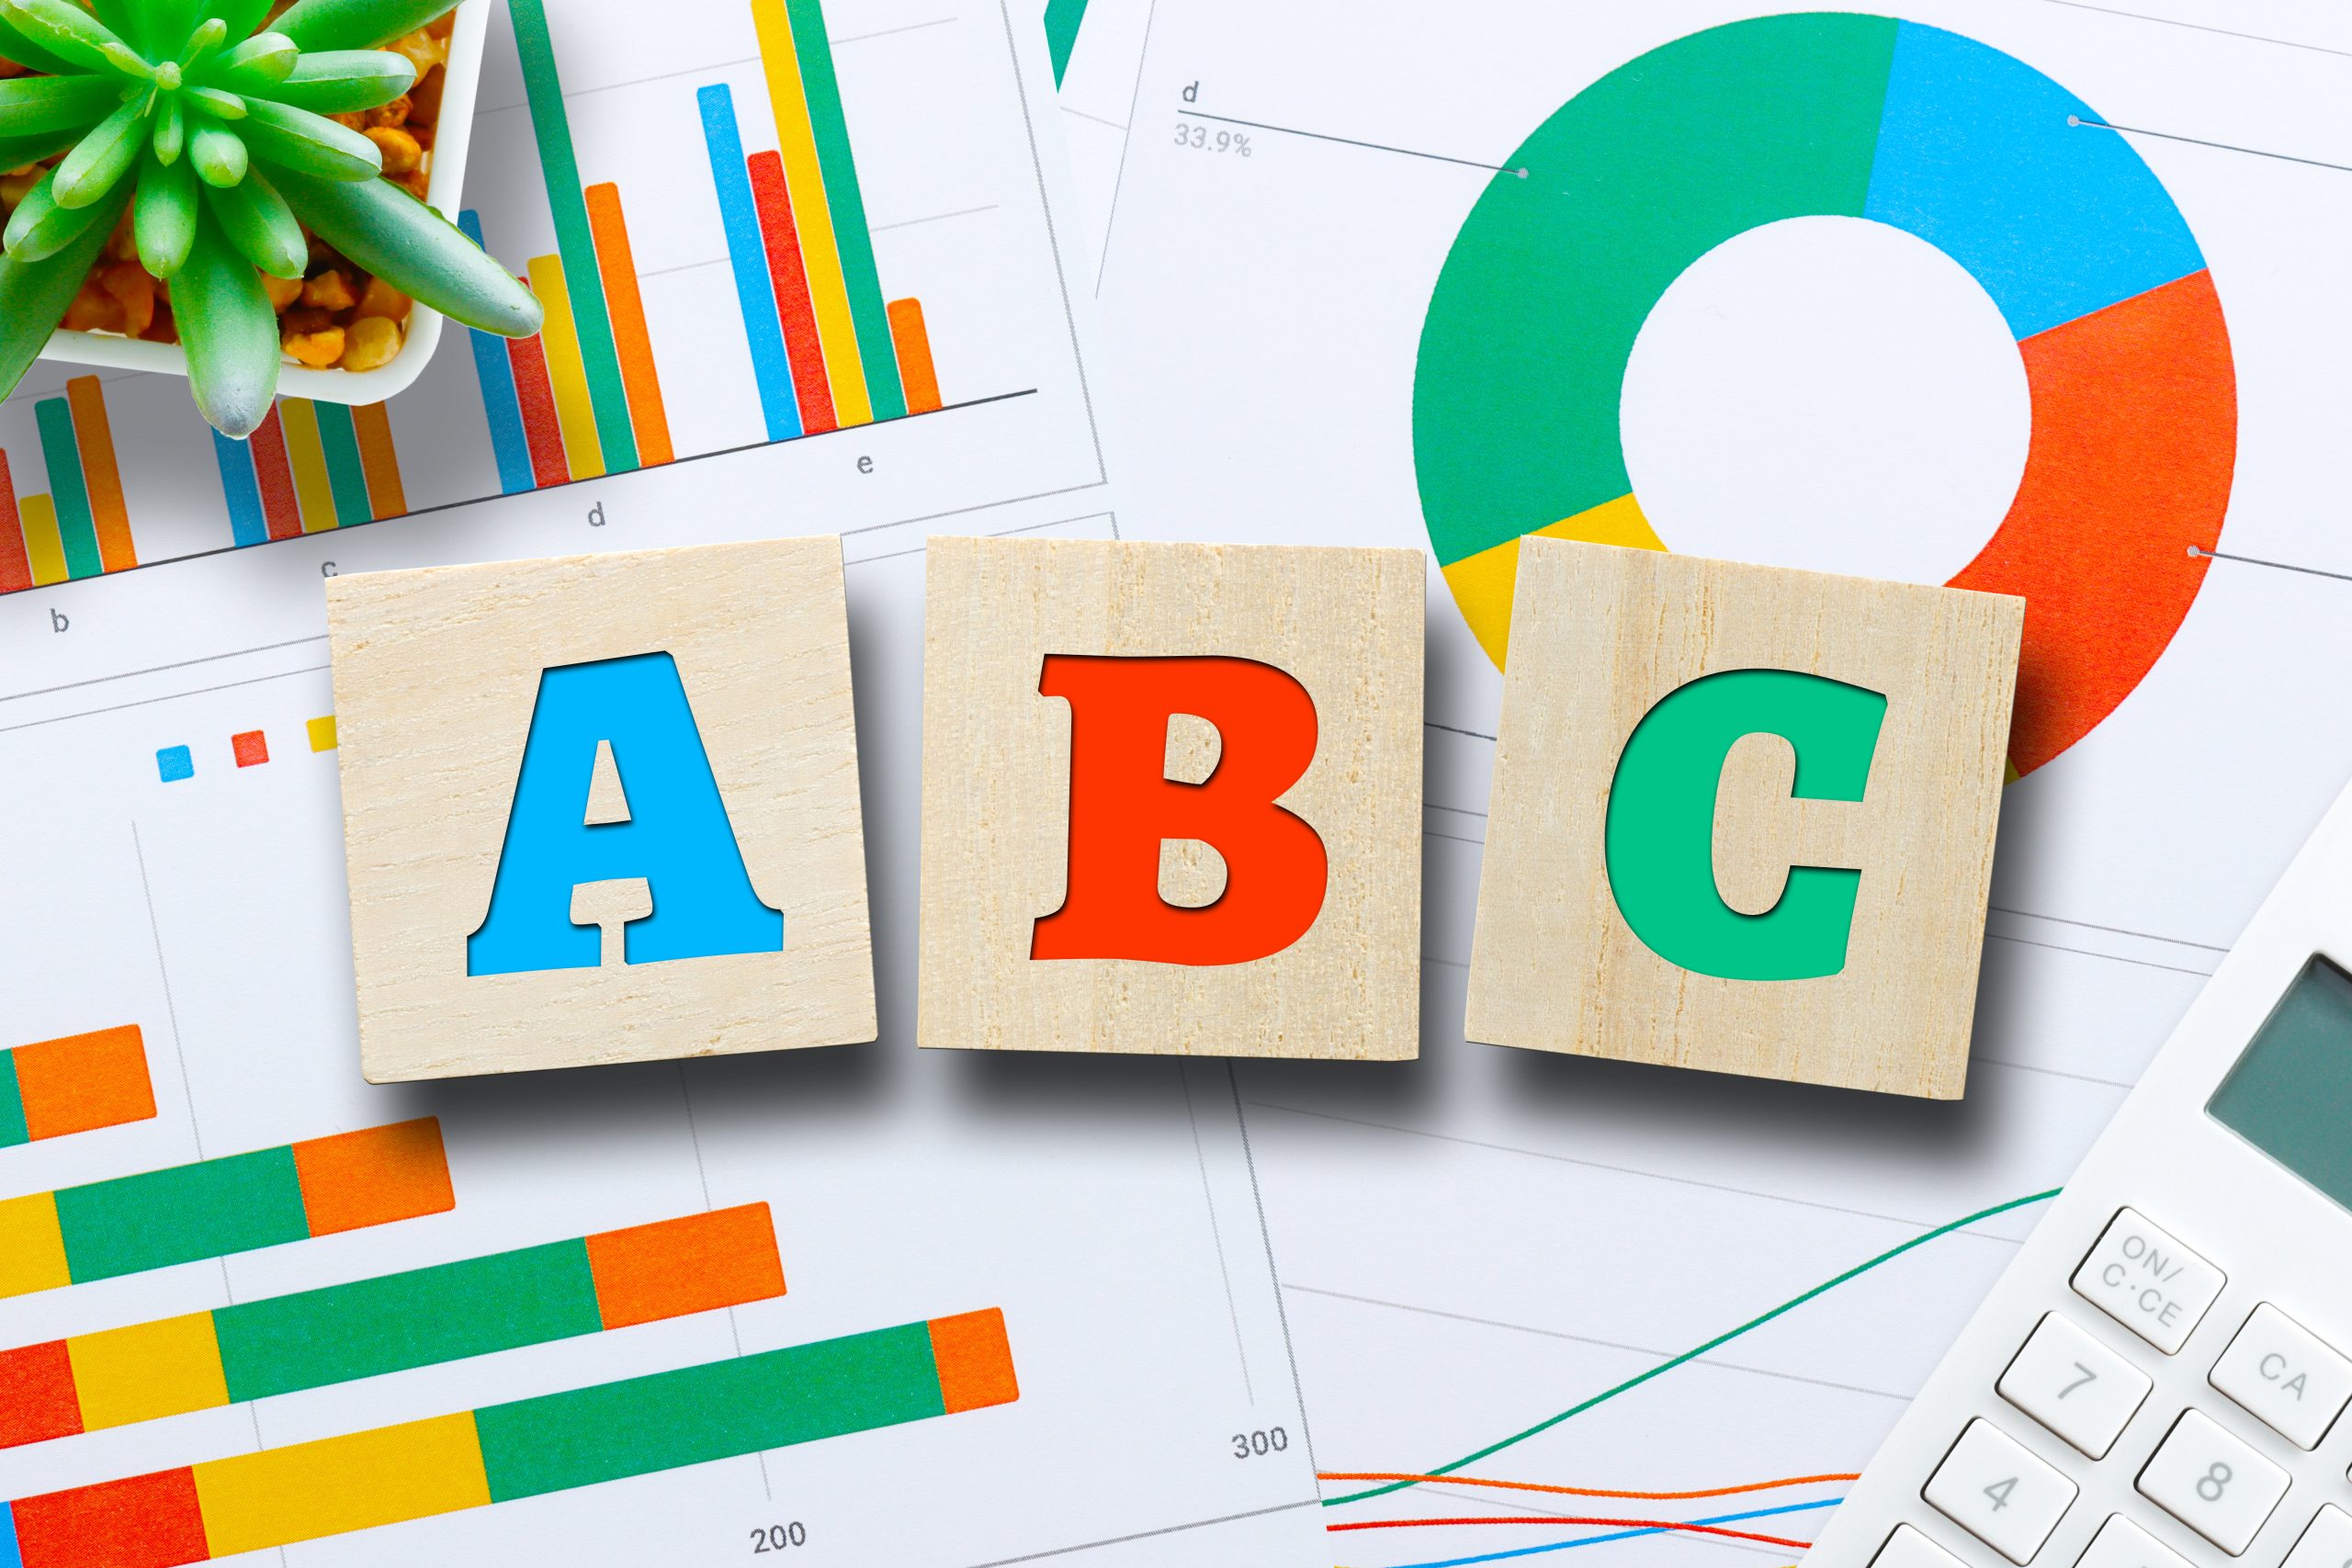
ABC analysis is a technique used in inventory management to classify items into categories based on their value to the business. It is a useful tool for companies to prioritize inventory management efforts and allocate resources effectively.
This inventory management formula is used to determine the value of each inventory item and classify them into A, B, and C categories.
The formula for ABC analysis is as follows:
ABC = (Annual usage value of an item / total annual usage value of all items) x 100
Where:
- Annual usage value of an item — The number of units sold or used during the year by the cost of each unit
- Total annual usage value of all items — The sum of the annual usage value of each item in an inventory
Suppose a company only sells three inventory items: shirts, shoes, and pants. Each item has a different price and annual usage value:
- Shirt — Price $25, annual usage value $40,000
- Shoes — Price $50, annual usage value $20,000
- Pants — Price $100, annual usage value $10,000
The total annual usage value for all items:
40,000 + 20,000 + 10,000 = 70,000
Using the ABC analysis formula, we can calculate the percentage of the total annual usage value for each item:
- Shirt — (40,000 / 70,000) x 100 = 57.14%
- Shoes — (20,000 / 70,000) x 100 = 28.57%
- Pants — (10,000 / 70,000) x 100 = 14.29%
Based on this calculation, the company can classify shirts as an A item since these generate 57% of the total annual usage value, shoes as a B item with 29%, and pants as a C item with 14% of the total annual usage value.
The ABC analysis formula helps companies identify which inventory items are most critical to their operations and prioritize their inventory management efforts accordingly. Items in category A require close monitoring and frequent replenishment, while B and C items may require less attention.
The ABC analysis formula helps companies optimize inventory levels, reduce storage costs, improve cash flow, and enhance overall profitability.
Let Katana do the math
Unless you’re a big fan of crunching numbers, you may want to leave these inventory calculations for somebody else or at least find a piece of software to help you in that department. Using Excel formulas for inventory control can do the trick, but it can also get messy quickly.
Katana is a cloud manufacturing platform that includes the features of live inventory management software and production management software. With its user-friendly interface and powerful features, Katana simplifies the inventory management process, helping businesses make more informed decisions and save time.
Its Insights and reporting tools offer a detailed overview of your business’ performance, including sales, manufacturing, resource use, orders, and more.
To ensure a unified experience, Katana integrates with the best business tools, like QuickBooks Online, Shopify, and Xero.
Overall, Katana can help businesses streamline their inventory management and production processes, save time, and make better decisions. With its powerful features and easy-to-use interface, Katana is an excellent choice for any business looking to improve its inventory management practices. Request a demo to see it in action.
Get inventory trends, news, and tips every month
Explore all categories
Get visibility over your sales and stock
Wave goodbye to uncertainty with Katana Cloud Inventory — AI-powered for total inventory control
