Say farewell to late deliveries by calculating fill rate
Fill rate is the metric of satisfaction and disappointment. We show you how to calculate and get the most out of it so your products always stay in demand.

Product making businesses like the guys at “Framed” need to make sure their order fill rates are as high as possible. Their brand’s success is tied to how reliable they are in delivering to customers.
What’s the worst thing that can happen to you in the first world?
We’ll tell you what.
Ordering a drink at a restaurant and it coming back half full.
No one is happy when they spend five dollars for a meager sip of orange juice. No matter how refreshing it tastes.
It’s the same thing when it comes to your order fill rate.
Fill rate is a metric of satisfaction and disappointment. It investigates how many of the orders your customers made were in stock and therefore likely reached them on time.
You want to make sure that you have a high enough fill rate to match customer needs, without overstocking and increasing your carrying costs.
A delicate balance as any for the manufacturing business.
Which is why we’re going to delve deep into the fill rate formula and work out how to walk the tightrope of this elusive metric.
But first, let’s make sure we understand what this tightrope is made of.
What is Fill Rate?
Alright, so let’s define fill rate.
Or rather let’s look into what order fill rate is. Because the metric simply relates to how successfully you can fulfill demand.
An order fill rate calculates how often a product is available for on-time delivery to customers that demand them.
But keep in mind that fill rates can also refer to other demands for your business.
For example, you could look at inventory fill rate which is related to your purchasing efforts. That would mean looking at your purchases and seeing how many times materials are ready to buy on demand when you need them.
If you purchase materials and they are only available half the time then you have yourself a 50% inventory fill rate.
You would then know to look into your supply chain and potentially finding a more reliable supplier.
Anyway, going back to the order fill rate definition. That’s when we look into how often we have items in stock when customers want them.
So if two times out of ten you are out of stock on an item then you have an order fill rate of 80%.
That might sound alright but actually, that’s not a great number.
The average order fill rate for manufacturers is around 95%, and you want to be making that your minimum target.
Otherwise, you’re going to end up with:
- Drop in sales due to unreliability;
- Customers turning to competitors; and
- Loss of reputation.
The last one is especially important because a bad reputation is hard to come back from.
It usually occurs when customers’ orders go through and then they are informed, or even worse uninformed, that their delivery will be late due to lack of stock.
Now the obvious answer might be to just overstock. But that’s just straight up bad inventory management.
It’s going to mean losing out on resources and potentially ending up with wasted stock.
Instead, you want to get on to that tightrope with the help of inventory management software that can get your fill rate as close to 100% as you can.
How to Calculate Fill Rate

Once you calculate fill rates for your products you’re going to want to make sure they actually improve. That means using the right tools and inventory software to keep your stock levels at optimum points.
Alright so here’s a shocker for you. There’s no standard way to work out your order fill rate.
Businesses have different data available to them which can vary the techniques used to attain this metric.
It’s already a different story if you pre-emptively display the stock of your items because many customers won’t even try to order if they see you’re out of a product.
Regardless though, there are two general methods we can take to work it out.
Method #1
This order fill rate calculation basically divides all successful orders by the number of attempted orders.
Here’s an example of how to calculate fill rate in excel.
First, you can simply create a spreadsheet with a list of your product on the one side and then create columns with attempted and successful orders on the other.
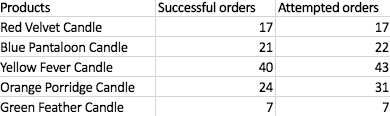
Then you can go ahead and add a new column for order fill rate.
Divide the successful orders column by the attempted orders column for each of the products and display them as percentages.
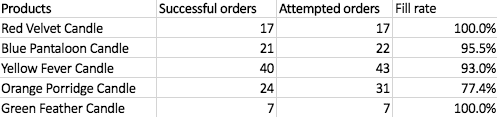
Simple as that.
You have your order fill rates for each of your products and can move on to getting the most out of them. But if you don’t have access to successful order attempts then try…
Method #2
Another way of working out order fill rates is to focus on how often an item goes out of stock.
This is a slightly different perspective to take because it doesn’t consider the amount of customer demand for a product. It just lets you know that there have been moments where an item has not been available for purchase.
In some ways that makes this method of calculation a little less valuable, but if your data is better suited then you can save some time here.
Anyhow, the way it works is that you first select a time frame in which to improve. This could be a month or even a week depending on how short your product lifecycles are.
Then you can count how many days your item was in and out of stock for in this period.
So, let’s say if your orange porridge candles were in stock for 28 out of 31 days then you can calculate your fill rate to be 90%.
Make Your Fill Rate Count
If you have the data and resources it might well be a good idea to calculate your order fill rates using multiple methods. That way you have an accurate picture which can highlight any discrepancies in your processes.
Alright, now we know our fill rates. But what do we do with this information?
Well, the first thing to do is look into why your fill rates are not at 100%. Because once you know the source of the issue you can get improving.
There’s going to be a good reason why, and usually, it’s going to come down to either:
- Unreliable suppliers;
- Bad shipping practices; and
- Poor inventory management.
In the case of unreliable suppliers, you might want to do a bit of searching to find better alternatives for sourcing materials or to diversify your supply chain.
If you see that you are having trouble with tracking your shipping then it might be a good idea to start integrating a shipping software like Shipstation. Or at least to pay more attention and focus to making sure you are sending your deliveries out as efficiently as possible.
But when it comes to inventory management, then it might get a little trickier. Especially if you are using inefficient inventory excel sheets to monitor your stock levels.
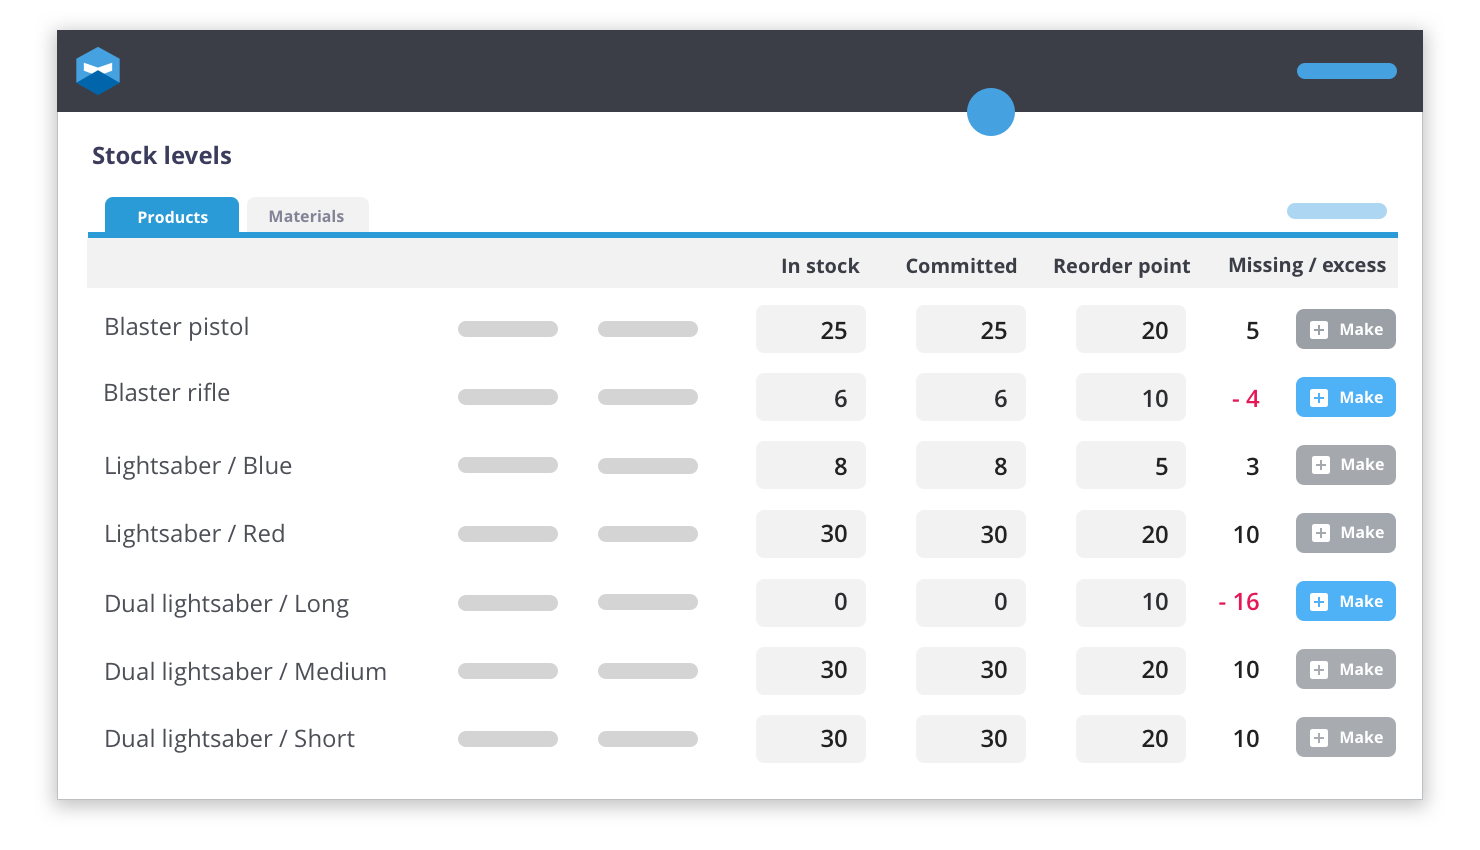
In this case, you’ll want to start looking into inventory software which can track your stock movements and ensure that you always have materials ready for your sales orders.
This kind of raw material inventory management is going to make it much more likely you hit that elusive 100% fill rate.
Fill Rate Damage Control
Okay, so realistically very few of us are going to hit that 100% mark. And even if we ever do, there’s going to be some swamps to wade through before we get there.
That’s why it’s important to identify products where the fill rate is lowest and come up with solutions to deal with these unhappy customers in the meantime.
In the example we gave, it would be the orange porridge candles, at a meagre 77% order fill rate. Meaning more than two of ten customers couldn’t get their brilliantly named bottle of wax.
Here are a few starting points to how you could deal with this:
- Offer alternative products – depending on what selling platform you use, often you have the option of offering alternatives when a product is out of stock. A lot of Shopify integrated stores offer this. Of course, you won’t improve your fill rate but will at least keep customers interested and buying.
- Contact customers – if orders are coming through and then you’re finding out that they’re out of stock then you have a problem. But whilst you solve that problem, make sure to be letting customers know that their delivery will be late as soon as you have that information. It will be appreciated.
- Reduce available product options – until you implement proper inventory management practices you might want to reduce the number of products you have on offer. Taking a product off the shelf with a low order fill rate might seem counter-intuitive, but if it’s mainly creating disappointment for the customer then it’s not worth having it there.
Bottom Line
Knowing your order fill rate can give you a great overview of how customers are satisfied with your ordering system.
And hopefully, you already have a fairly decent percentage for your products as they are.
But remember that every customer that can’t or doesn’t get the product they desire in the timeframe you promise is going to tarnish your company’s services.
It’s much easier to retain trust than to gain it back.
This is why it’s important that you have your inventory ready to serve the sales orders that are bouncing in.
Katana Cloud Inventory software is a platform that can not only help you attain optimal levels of inventory but also streamline your whole manufacturing business.
That means taking care of your manufacturing, inventory, and sales from a dashboard designed for the maker’s eye.
It’s going to be of particular use in these cases:
- Orders getting delayed or lost;
- Overloaded with spreadsheets;
- Inefficient inventory, whether that be over or understocking;
- Struggling to track raw materials;
- Not knowing when to purchase more materials; and
- Lacking production planning and scheduling.
Once you have these elements in place you can make sure to have a stock room that runs like clockwork and serves your customers.
Your fill rate can only improve with all the unnecessary heavy lifting being taken off your hands.
Get inventory trends, news, and tips every month
Explore all categories
Get visibility over your sales and stock
Wave goodbye to uncertainty with Katana Cloud Inventory — AI-powered for total inventory control
