A guide to store performance dashboards

Retail is a data-driven business. With so much competition, more and more physical stores are using data from sales transactions, customer interactions, and other sources to adapt their business strategies. One powerful way to do this is with a store performance dashboard.
Imagine being able to get a visual overview of your retail store’s performance in real time. This is all possible with the help of a store performance dashboard. In this guide, we’ll be covering everything you need to know about implementing and using this technology, as well as examples of how you might use it for your own business moving forward.
What is a store performance dashboard?
A store performance dashboard is a tool that tracks the progress of your physical store and displays it in an easy-to-use format, like a graph. Rather than getting bogged down in thousands of lines of data, these dashboards are designed to provide a quick snapshot of how your store is performing on any given day.
The dashboard will look at your business’ key performance indicators (KPIs) to see the progress you’re making toward company-wide goals. This could be anything from boosting overall sales to reducing the amount of product returns.

The great thing about store performance dashboards is that you can adapt them to measure data that matters to you.
Let’s say you want to focus on individual employee sales. Your dashboard will be able to tell you the average sales made by each individual team member and the star of the show on any given retail day. That way, you can develop strategies for boosting the overall sales figures of your team.
Why is it useful?
It can be hard to stay competitive in the crowded retail market. To have any chance of succeeding, you need to make the right decision every time. Store performance dashboards make this a lot easier. Rather than making a guess, this dashboard gives you all the insights you need to tailor your strategy to your store.
You get real-time visibility into your store’s performance
With a performance dashboard, you can see how your store is doing at any given moment. Your business can use these insights to either create a new strategy for boosting sales or to adapt and evolve a strategy currently in place.
Dashboards improve your ability to make good decisions
Because you can access up-to-date insights into your performance based on metrics like customer behavior and sales trends, dashboards allow you to see what’s working and where you can adapt your current strategies.
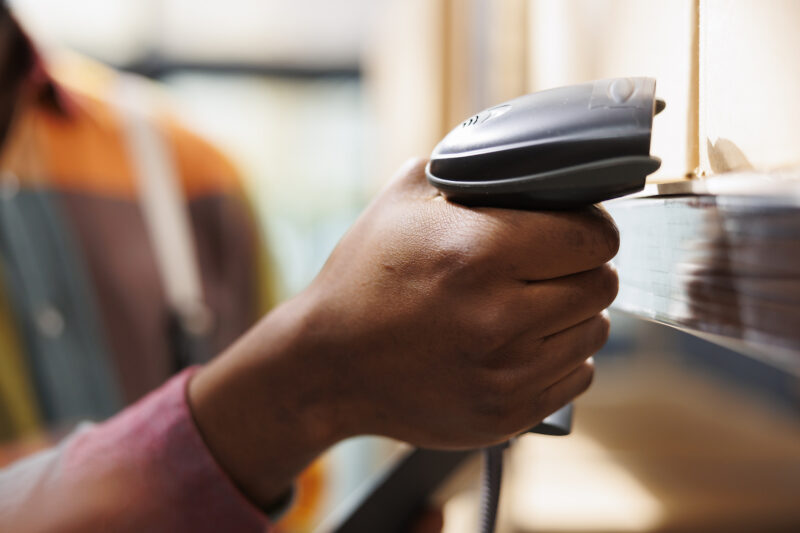
Experience better inventory management
You have the option to track your inventory within a store performance dashboard, giving you insights into your inventory levels, stockouts, and demand forecasting. This data can help you optimize your inventory levels so you can spend less on holding costs.
Improve the customer experience
Using a store performance dashboard, you can gain valuable insights into what your customers like. This will allow you to personalize the customer experience further so that they’re fully satisfied every time they visit your store.
Manage your staff better
Store performance dashboards allow you to monitor your staff in an unprecedented way. You can access sales, attendance, and productivity in real time. Rather than using it as a way to punish unproductivity, use these insights to optimize your staffing levels and provide training to those who need it.
What KPIs should be included in a store performance dashboard?
The KPIs you decide to include in your store performance dashboard depend on your retail business’ individual goals. Here’s a snapshot of a few that you might want to include and why.
Sales revenue
The sales revenue KPI is the total sale transactions generated in your store. While this might seem a simple metric to track, it can be a great way to get an overall view of your financial performance — especially for physical retail stores.
Adding sales revenue to your store performance dashboard will show you:
- Overall financial performance
- Sales trends over time
- How well your marketing campaigns are doing

Gross margin
The gross margin is simply the difference between your sales revenue and the cost of goods sold (COGS) expressed in a simple percentage. Plugging your gross margin into a store performance dashboard will show you:
- The profitability of your store sales
- Whether your pricing strategy is working
- Help with cost management
If your COGS percentage is high, it may indicate that your products are priced too low or that you aren’t making enough sales to be sustainable.
Average transaction value (ATV)
Your average transaction value (ATV) is the average amount of money spent by customers for every transaction made in-store. This is a great way to see:
- Customer spending patterns
- How well your upselling efforts are working
- Whether promotional offers are having an impact on overall spend
Customer traffic count
The number of visitors entering your store every day can be tracked using the KPI customer traffic count. This is especially important given that more customers are choosing to shop online than ever before.
By entering customer traffic count into the retail store performance dashboard, you’ll be able to see:
- Store traffic patterns (when your store is at its busiest)
- Peak hours
- Staffing needs based on customer flow

Inventory turnover
Inventory turnover is a KPI showing the rate at which inventory is sold and replaced in your store in a specific period, like a month. You can use inventory turnover to:
- See whether your current inventory management strategy is working
- The popularity of your products
- Avoid potential stockouts or overstocking your shelves
Quick tip
These are just some of the KPIs you might want to track in real time using your retail store performance dashboard. Before deciding on your KPIs, write down your store’s short- and long-term goals, as this should help you make the right decision.
What are the key elements of a store performance dashboard?
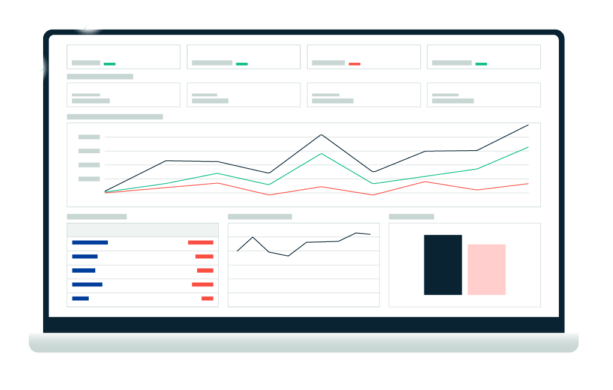
A retail store performance dashboard is a visual representation of your store’s metrics and data points in an easily readable way. On a typical dashboard, you’ll find these elements:
- KPIs — The metrics that measure your store performance
- Visualization — This could be charts, bar graphs, pie charts, and heatmaps so you can interpret data from a quick glance
- Real-time updates on your store — This allows managers to look at the most current information throughout the day
- Comparative analysis — Retail dashboards usually let you compare current and historical data so you can see deviations from the norm
- A drill-down option — Allowing users to see data in a more detailed way. All you need to do is click or hover over your visualizations to see the raw data
- Alerts — Every retail dashboard will have an alert option, notifying managers if there are any significant changes in store performance metrics, like a drop in sales revenue
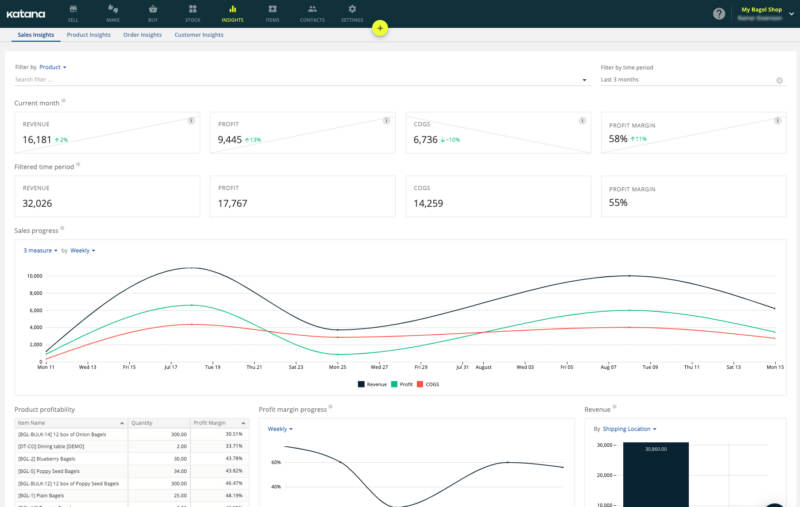
Retail dashboard example
Let’s take a look at how a retail store performance dashboard may look in practice.
For most retail stores, profitability and inventory are paramount. A retail dashboard will likely include KPIs related to sales, finance, and inventory, typically presented in a bar chart or pie chart. It should include the total sales for a particular time period or quarter and a trajectory or where sales are expected to reach.
Boost your retail business with Katana
Katana’s inventory management software will empower you to make salient decisions based on real-time data from your retail store. Track your KPIs using Katana and optimize your inventory management to avoid overstocking or stockouts.
With Katana, you can seamlessly integrate with other essential retail store tools like QuickBooks and Shopify to build custom workflows that fit your business.
Ready to transform your business with powerful store performance dashboards? Get a demo and get started with Katana today!
FAQs
Store performance dashboards are only useful if you can customize them for your retail store. Every reputable dashboard is highly adaptable, so you can tailor it to fit your unique goals as a business. The way this is usually done is by inputting the KPIs that you’d like the retail dashboard to track for you.
Most store performance dashboards will update your data in real time so you can access the most current information on your store’s performance on any given day. This allows you to make the right decisions for your business based on the latest data.
If you own more than one store, you can implement performance dashboards across them all. That way, you can monitor the performance of all your stores and compare their profitability. With this information, you can carry over positives from your most successful store to all other branches.
Get inventory trends, news, and tips every month
Explore all categories
Get visibility over your sales and stock
Wave goodbye to uncertainty with Katana Cloud Inventory — AI-powered for total inventory control
