Where’s the bottleneck? Inventory Accuracy Audit and Improvement Plan
Stock numbers not matching between tools and shelves?
This guide walks you through a practical inventory accuracy audit, shows you where data falls out of sync, and gives you a simple plan and checklist to fix the biggest bottlenecks.


Inventory accuracy degrades because the connection between physical stock and digital records is rarely real-time. Without tight integration, unlogged returns or manual adjustments leave a permanent difference between what sits on shelves and what appears in your main sales or inventory system. Additional tools, such as a 3PL (Third-Party Logistics) portal or a separate spreadsheet, often make those differences bigger because each one can hold its own version of the same products.
The mismatch gets worse over time. Accounting often flags valuation issues only after quantities feeding decisions in sales and operations have been out of date for weeks. The weak spots sit in handoffs where stock moves but nobody updates the record, or where people maintain side systems that never sync back.
Before changing tools or adding new integrations, it helps to see exactly how inventory data moves through your setup and where it falls out of sync. That starts with seeing why multi-tool environments tend to lose accuracy in the first place.
Why inventory accuracy breaks in multi-tool setups
The “everything is connected” myth
Data flows between systems can make inventory look more controlled than it is. Orders land in an operations app, and stock levels sync back to a sales channel. The issue is that a sales channel tracks what can be sold, while an operations system tracks what can be picked or produced. Because these views update at different times, quantities for the same SKU (Stock Keeping Unit) often disagree. Sync jobs then copy those mismatches into other tools, replicating the error across your stack.
E-commerce stock vs physical stock
Sales channels show availability to customers, which drives daily decisions. Physical stock in a warehouse or at a 3PL often shows something else. This usually happens when stock edits in the sales channel don’t reach the inventory system, or when warehouse changes stay inside a local tool. Both numbers might look right individually yet still fail to match. An accuracy audit needs to treat the channel view and the physical view as separate data sources and measure the difference between them.
3PL delays and “black box” behavior
A 3PL’s WMS (Warehouse Management System) usually holds the most accurate numbers for stock stored at that partner. But those numbers often reach the rest of your stack on a delay or in a simplified format. You see this lag as overselling, recurring backorders, or support teams logging into the WMS directly because they trust it more than internal reports. The 3PL operations work fine; the issue is usually how the WMS connects to your inventory and sales tools, and how often it pushes updates.
Manual adjustments, returns, and side systems
Unlogged returns and damaged goods change availability as soon as they leave the regular storage locations for sellable stock. If those movements live only in notes or spreadsheets, the central system keeps reporting quantities that no longer exist.
Multiple locations with partial data
New locations usually get added one by one. You open a second warehouse to handle volume, or a 3PL starts shipping a portion of orders. Each place develops its own habits for recording movements. Locations vary in data quality: some send frequent, structured updates, others report through irregular summaries or occasional imports. Transfers often leave stock sitting “in transit” with no clear owner in the data. In many businesses, a single location or connection creates a large share of the inventory inaccuracy. The goal is to identify that specific source before it causes a stockout.

Inventory accuracy audit: step-by-step
The goal here is not to count everything at once. This audit gives you a focused pass through the parts of your setup that create the most confusion, linking the places stock sits to the systems that claim to track it, then checking how far those records are from what you can physically see.
Phase 1: Map where inventory lives
Step 1: List every place that holds stock
Start with physical reality. Write down each place that holds inventory today: main warehouse, 3PL sites, retail stores, office storage, contractor locations, long-term “in transit” areas. For each one, note how stock is stored.
What to check:
- Are any of these locations missing from your main inventory system?
- Do staff treat any “temporary” areas (returns corner, QC table, sample shelf) as long-term storage?
Healthy outcome: every physical location has a clear name, including the messy corners, and you can see which ones exist in your system and which ones only exist on the floor.
Step 2: List every system that claims to know stock
Now map the digital side. List the tools that store product and quantity data: main inventory or production system (like Katana), sales channels, 3PL/WMS portals, spreadsheets, and accounting if it tracks item-level stock.
What to check:
- Which tool is supposed to be the operational “source of truth” for quantities?
- For each physical location from Step 1, which system does the team actually check first?
Healthy outcome: you can draw a simple picture of “stock lives here physically, and this is the system we should trust for that location”. If you have locations with no clear system, mark them for later.
Phase 2: Clean up master data
Step 3: Check product and SKU consistency
An audit built on messy product data won’t help much. Pull your product list from the systems you listed in Step 2 and compare them.
What to check:
- Duplicate SKUs for the same product.
- Different SKUs used for the same product in different tools.
- Products sold but never listed in the inventory system.
Healthy outcome: one SKU per product (or clear variant rules) across the systems that matter for daily operations. Anything that breaks that rule goes on a “to fix” list, not straight into a new count.
Step 4: Confirm units and pack sizes
Unit mismatches create small discrepancies that never look like “errors” on screen.
What to check:
- Items bought in cases but tracked in units, or the other way around.
- Weight-based products where different tools use different units.
Healthy outcome: each product has a single base unit for counting, and any case or pack sizes are defined explicitly. Everyone involved in buying and receiving works to that same definition.
Step 5: Align locations and tracking rules
Location names and tracking methods need to line up with how you work.
What to check:
- Location list inside your inventory system: does it match the physical list from Phase 1?
- Tracking rules: which items use batches or lots, which use expiry dates, which (if any) use serials.
Healthy outcome: no “mystery locations” that exist in one place and not the other, and clear rules for which products require traceability. Anything that needs lot or expiry tracking has that rule set in the system you plan to use during the count.
Phase 3: Compare system counts to physical counts
Step 6: Choose a focused sample
Instead of trying to count everything, pick a mix that will reveal problems quickly.
What to check:
- High-value items.
- Fast movers.
- Products the team already complains about (“this SKU is always off”).
Healthy outcome: a list of SKUs and locations you can realistically count in detail within a day. This sample becomes your test bench for the rest of the audit.
Step 7: Count the sample physically
Run a structured count for the sample list.
What to check:
- Physical quantities at each location on the list.
- Clear notes where you find returns, damaged units, or items in unusual spots.
Healthy outcome: a simple table with SKU, location, and “what we actually found”. No adjustments yet, at this stage, just current data.
Step 8: Compare counts across systems
Now put the physical numbers against your digital records.
What to check:
- For each SKU and location, what does your main inventory system say?
- What does the main sales channel show as available?
- What does the 3PL/WMS show, if relevant for that SKU?
Healthy outcome: you can point to concrete differences, not just a feeling that “numbers seem off”. For each discrepancy, note whether it comes from late updates, missing locations, unit mismatches, or unlogged movements.
Phase 4 – Check orders and in-transit stock
Step 9: Look at open sales and reservations
Available stock is not the same as total stock.
What to check:
- Items already committed to open sales orders but not yet shipped.
- Backorders and pre-orders that depend on future receipts.
Healthy outcome: a clear distinction between “on hand” and “available to sell”. When you see overselling, you can tell whether it comes from bad counts or from missing reservations.
Step 10: Look at open purchases and transfers
Incoming stock and stock in transit affect what you think you can promise to customers.
What to check:
- Open purchase orders and expected delivery dates.
- Transfers between locations, including stock held by contractors or 3PLs before it appears as on hand.
Healthy outcome: for each item in your sample, you know whether extra units are on the way or sitting between locations, and whether that movement is visible in your systems.
Phase 5 – Tie to accounting and capture patterns
Step 11: Compare inventory valuation to accounting
This step checks that the financial picture roughly matches the operational one.
What to check:
- Total inventory value in your inventory system.
- Inventory asset account in accounting.
Healthy outcome: any difference is explainable in a short note (timing of adjustments, write-offs not yet posted, etc.). If the numbers are far apart with no clear reason, note that as a separate issue to handle with your finance team.
Step 12: Summarize issues, don’t just fix counts
It is tempting to adjust everything to match the physical count, but that hides the useful part of the audit.
What to check:
- Recurring themes: a location that is always off, a product family with constant problems, a connector that never reflects reality.
- Steps in the process where data consistently lags behind stock movement.
Healthy outcome: a short list of “sources of inaccuracy” with concrete labels like “returns area not booked in”, “side spreadsheet for wholesale adjustments”, or “3PL transfer timing unclear”. These will feed directly into the improvement plan in the next section.
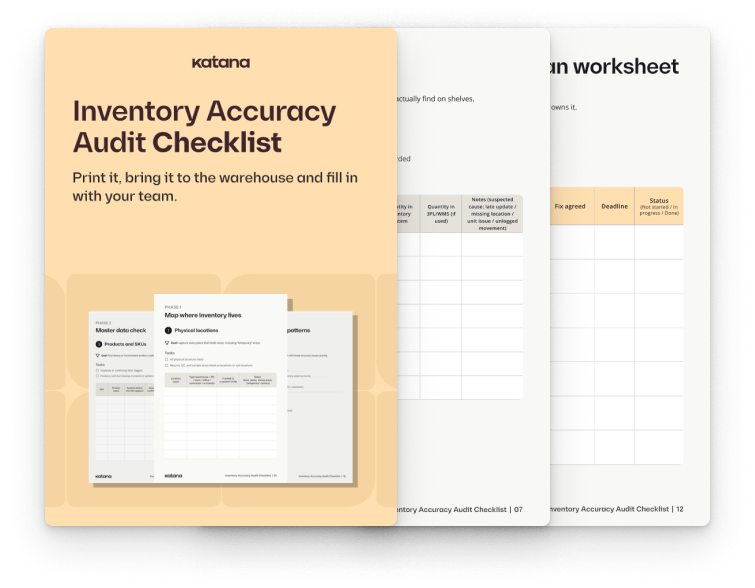
Free checklist for your inventory team
A simple worksheet to map stock, compare system numbers to real counts, and note what needs fixing.
Turn your findings into an improvement plan
Use the audit results to decide what gets fixed now and what can wait. Put issues that cause stockouts or overselling at the top. Leave small discrepancies on low-value items in a “monitor” list.
For each priority issue, define one specific change in how work is done. That could be a short cycle-count routine for a handful of SKUs, or a rule that returns are booked into the system before they leave the cart at goods-in. When two tools keep showing different quantities, choose one place to correct numbers. If you use an inventory system like Katana, make that the first point of correction and let it update connected sales channels, instead of editing figures in several tools.
Assign clear owners. Each main location needs someone responsible for counts and stock changes there. Product and location data need an owner as well, so SKUs, units, and locations stay consistent after clean-up.
Then identify tasks that are frequent and rule-based, such as moving orders between tools or updating available stock across channels. Those are good candidates for automation via native integrations, 3PL connectors like Extensiv, or tools such as Make or Zapier alongside Katana, while people focus on decisions like write-offs and investigating large variances.
How Katana fits into an accuracy-focused stack
The audit assumes you have one place that holds the operational truth for stock. For many product businesses, that ends up being an inventory and production system like Katana.
Katana tracks stock per product and per location, including what is on hand and what is already tied to open orders or incoming from suppliers. Stocktakes and adjustments live in the same place as manufacturing orders, outsourced production, and basic reorder settings, so counts and production activity use the same data.
From there, Katana connects to the tools you already run. Orders and stock can sync with Shopify and other ecommerce platforms. Inventory values and product data can sync with accounting tools such as QuickBooks Online or Xero. 3PL and shipping flows run through partners like Extensiv, or through automation platforms like Make or Zapier, so movements recorded in external WMS or shipping tools update Katana instead of staying in separate portals.
Used this way, Katana becomes the system you check first during the audit phases above, and the place where you keep locations, counts, and order flows aligned once the initial clean-up is done.
Where to start: a small, practical pilot
A full overhaul is rarely needed on day one. A contained pilot shows whether the approach works for your business without putting everything at risk.
Pick one warehouse or 3PL site, one main sales channel, and a limited product group such as your top sellers. Mirror that setup in Katana: create the locations, sync or import the products and opening stock, and connect the chosen sales channel. Keep accounting connected in read-friendly mode at first if you prefer, so finance can see the picture without changing their process yet.
Run the audit steps on this slice only. Use Katana for the stock views, orders, purchases, and transfers for that scope, and adjust processes at that location first. Over a few weeks, watch for fewer stockouts or oversells on that channel, fewer manual corrections, and clearer conversations between operations and finance.
You can do this on Katana’s free plan with your own data. There is no credit card requirement, you can manage up to 30 SKUs for free, and you can switch to a 15-day trial with unlimited SKUs and all features and add-ons if you want to test the full setup with a larger catalog.
Get inventory trends, news, and tips every month
Explore all categories
Get visibility over your sales and stock
Wave goodbye to uncertainty with Katana Cloud Inventory — AI-powered for total inventory control
